2026
Ledgerleaf
From supplier invoices to a buyer-ready carbon report — in one sitting.
Carbon accounting a small company can actually finish: connect invoices, auto-map to Scope 1-3, set a target and export a buyer-ready report.
A self-initiated concept, designed like a real product.
The brief we set ourselves
Design carbon accounting that a small company can actually finish: connect the accounting system, map every invoice to Scope 1–3, set a reduction target and export a report a customer will accept.
Who it is for
Finance and operations leads at 20–500-person companies whose customers now ask for emissions data — people who know invoices, not climate science.
What we designed
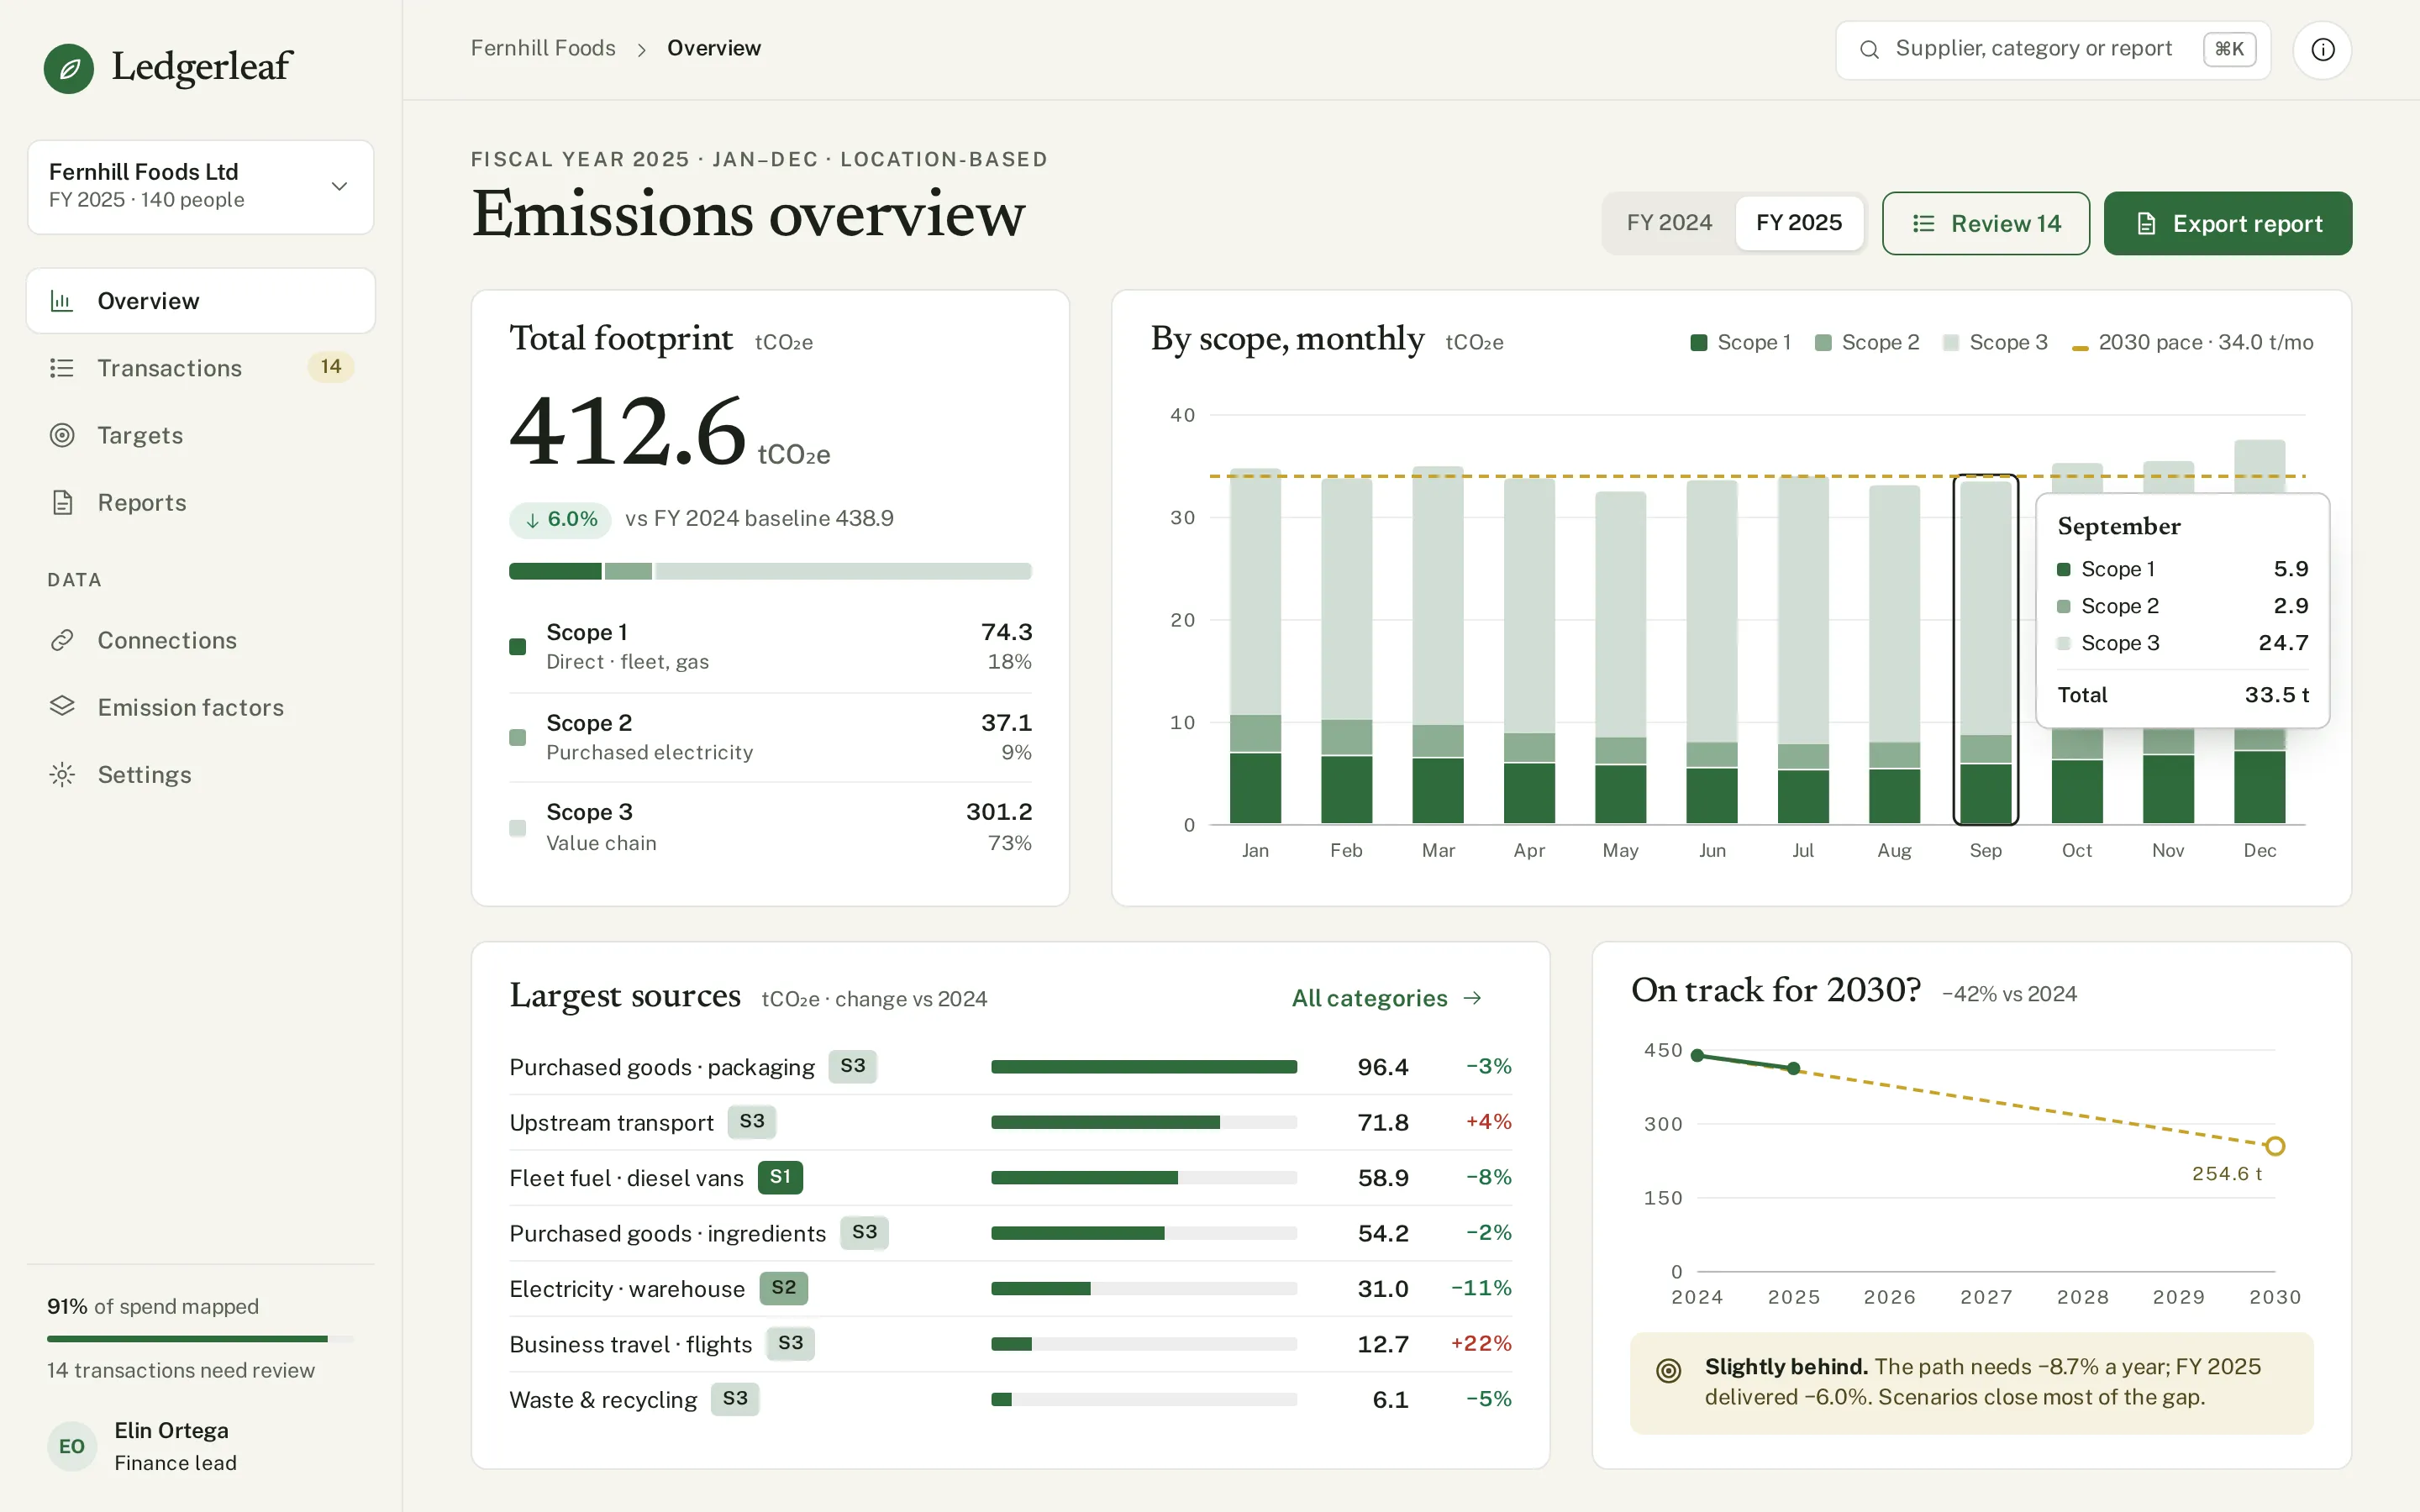
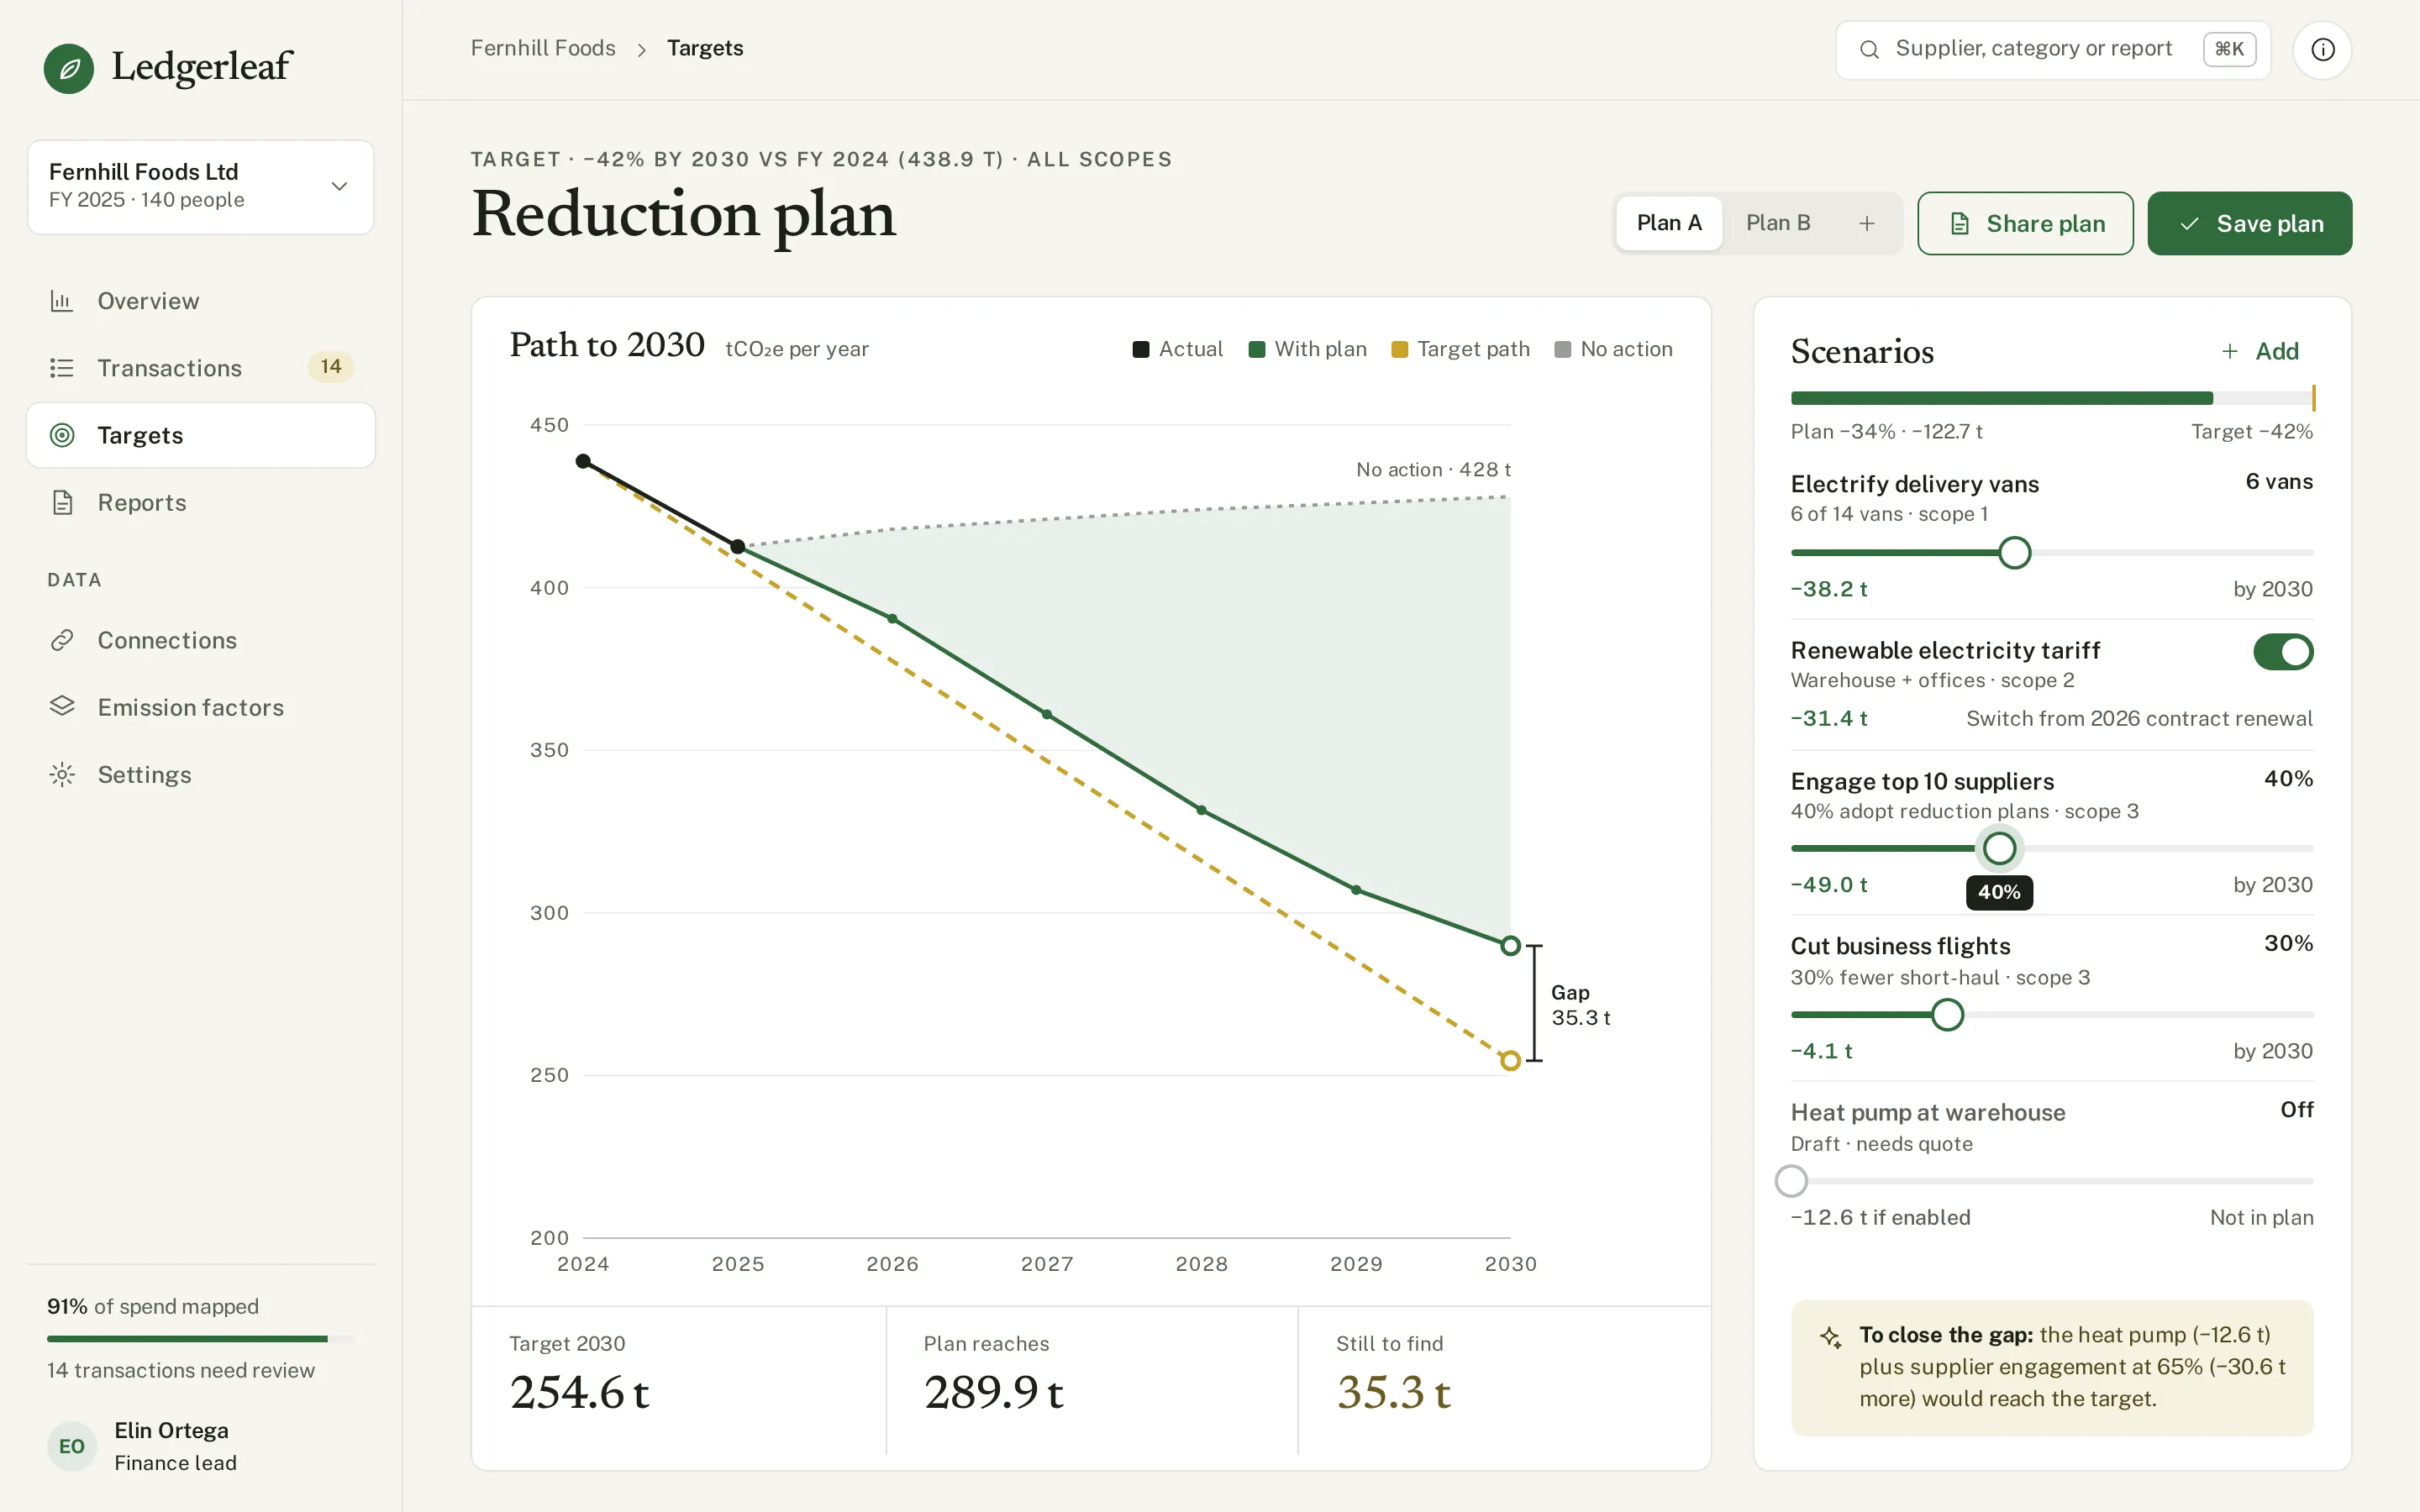
An emissions overview, transaction mapping with a decision panel, a reduction plan with levers and a wedge chart, the report export with readiness checks — and the components behind them.
Design facts from the concept files — not business results.
02ResearchSmall firms are asked for carbon data they cannot produce.
We sized the carbon-accounting software market, looked at what the category leaders automate, and at how carbon dashboards are shown in the galleries — mostly abstract CO₂ charts with no path from an invoice to a report.
We sized the carbon-accounting software market, looked at what the category leaders automate, and at how carbon dashboards are shown in the galleries — mostly abstract CO₂ charts with no path from an invoice to a report.
- Market
Carbon accounting software is estimated at about $1.6B in 2025, growing to about $7B by 2032 (CAGR 23%).
DecisionA fast-growing B2B category — design for the mid-sized supplier asked by its buyers, not for the enterprise sustainability team.
- Gallery gap
Most carbon concepts on Dribbble are a single dashboard of rings and stacked bars; the work in between — mapping spend, closing gaps, exporting — is not designed.
DecisionShow the whole journey as four screens: overview → mapping → plan → report, each answering «what do I do next?».
- Trust
Spend-based estimates are only credible when the factor and its confidence are visible next to the amount.
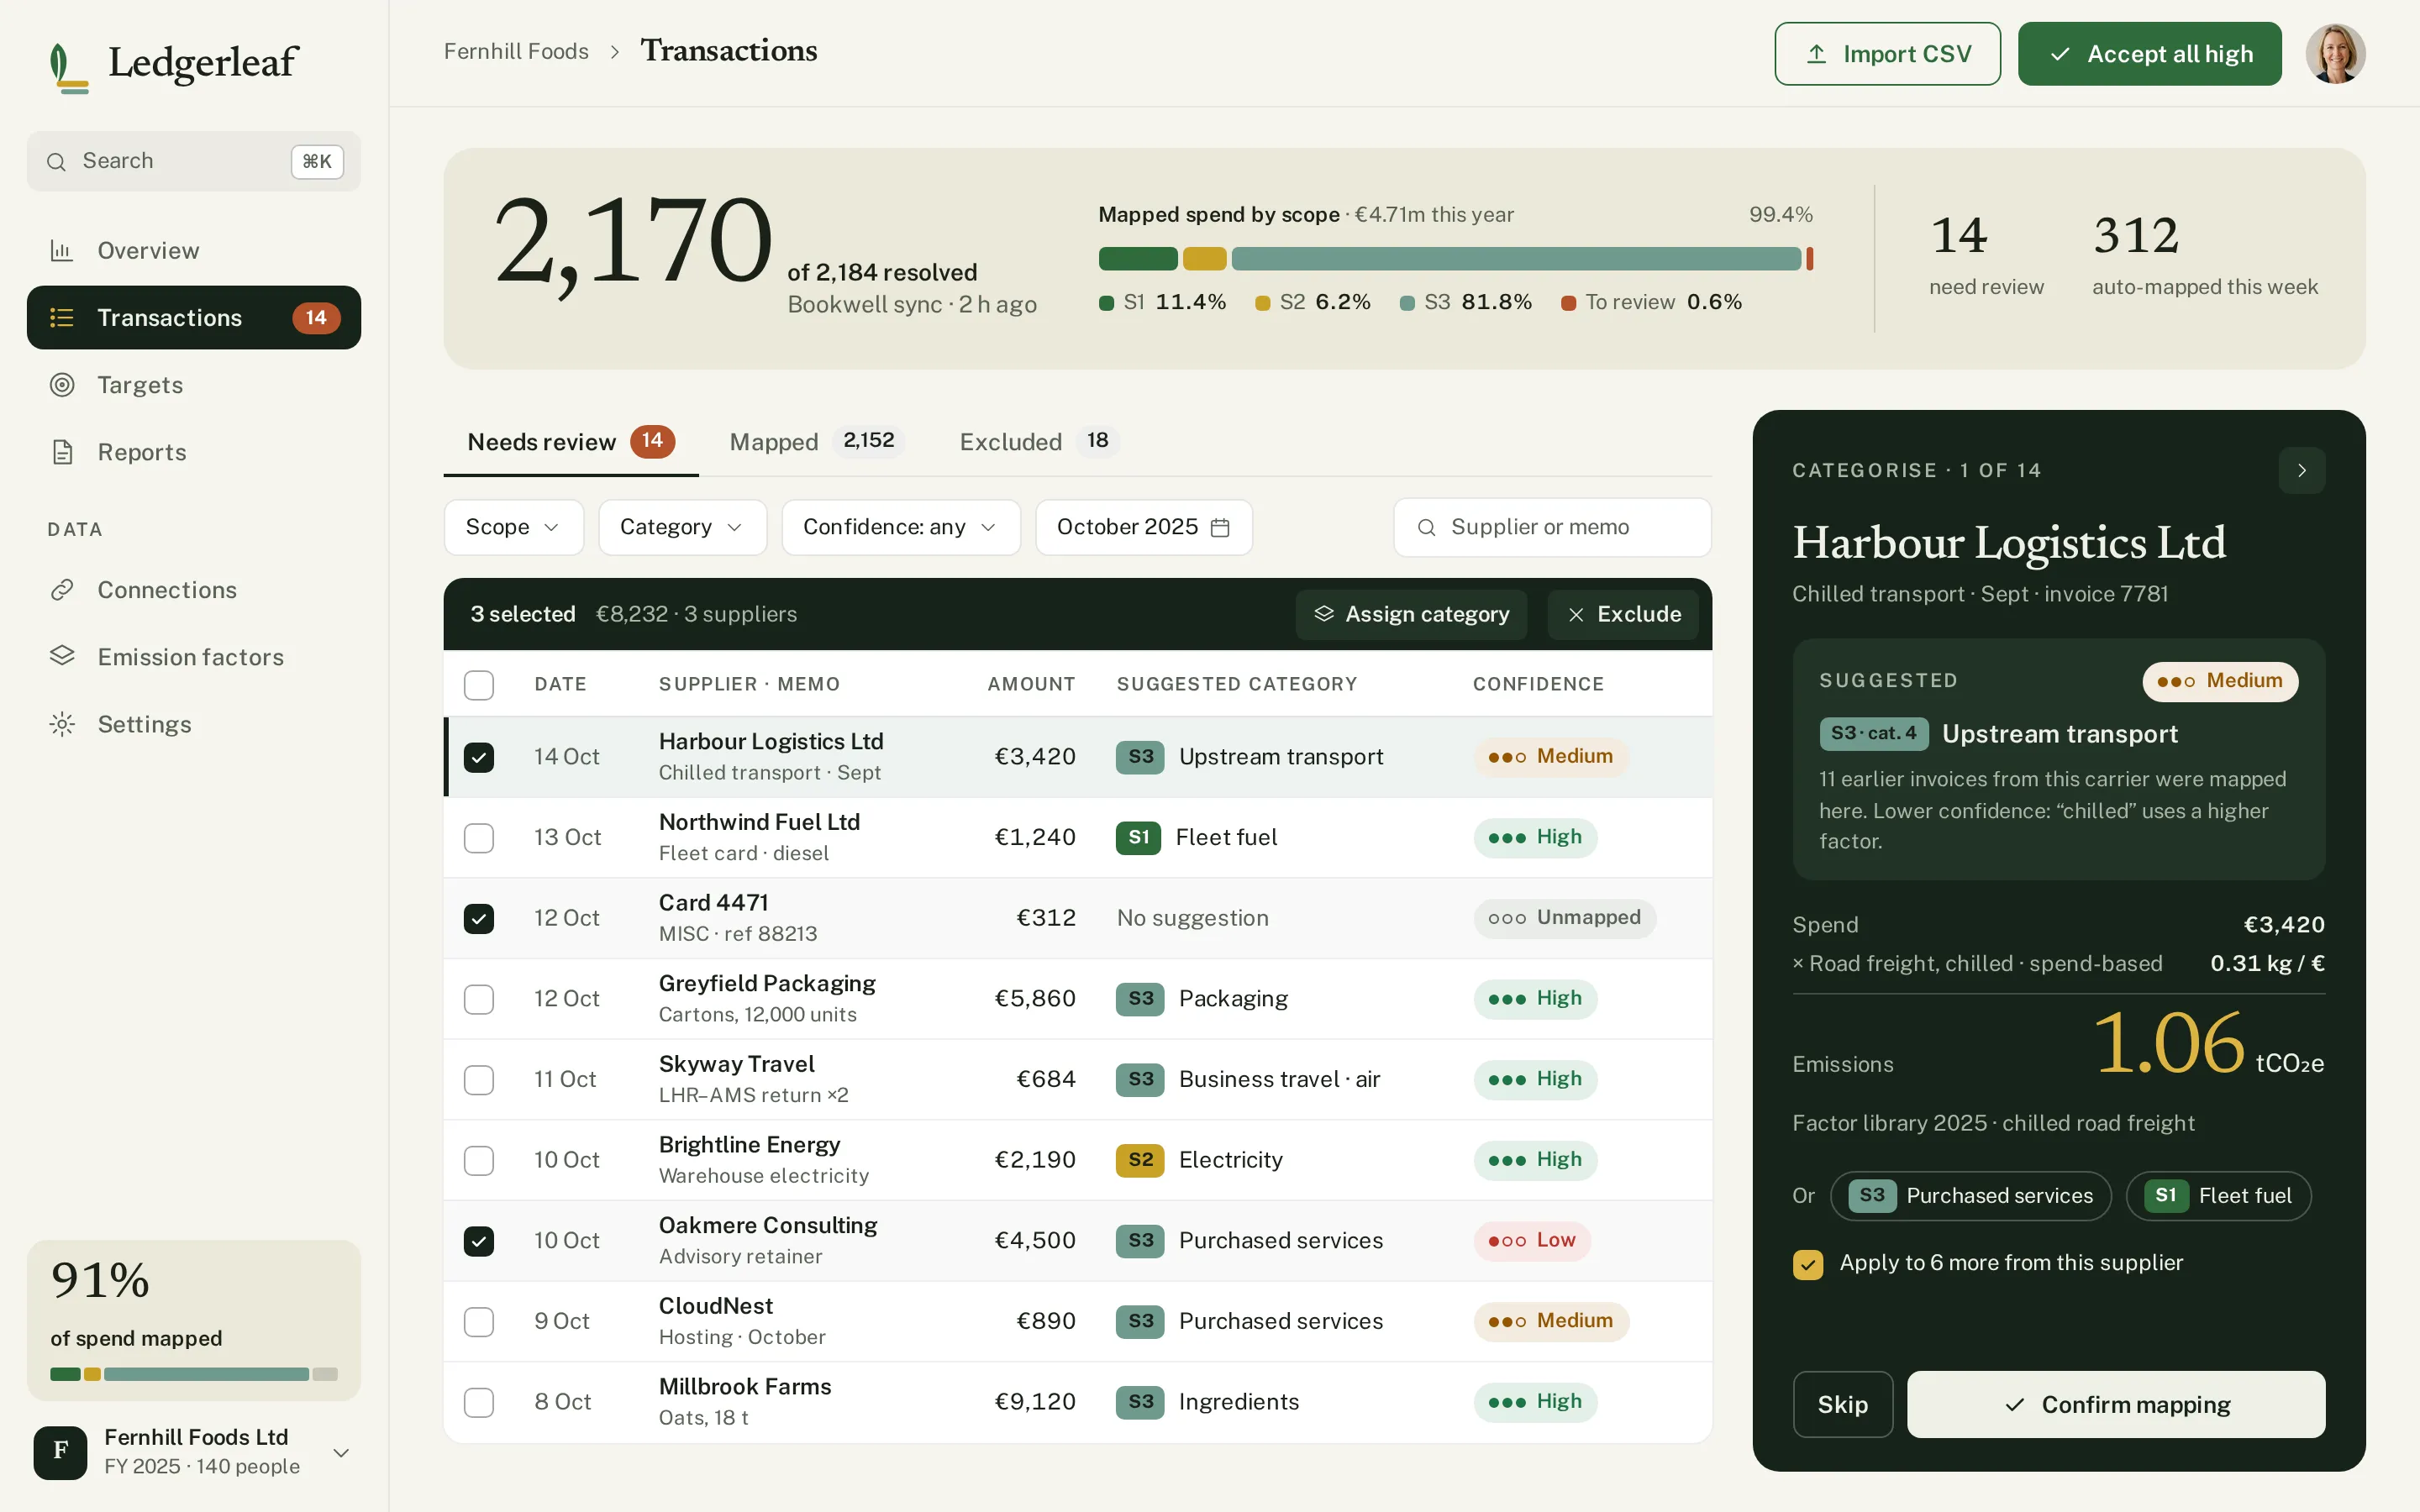
DecisionA typographic equation on every decision — €3,420 × 0.31 kg/€ = 1.06 t — confidence dots on every row and a readiness check before export.
Patterns we borrowed
- Normative
- Only the functional scope — automated carbon accounting for companies; its design was not audited or reused
- Bookkeeping apps
- A review queue with bulk actions and «apply to 6 more from this supplier»
- Climate charts
- Stabilisation wedges: each lever as a wedge between «no action» and the target
- Annual reports
- A cover, a by-scope table and page thumbnails on a dark desk
What we left out
Logos, copy, illustrations and screens of Normative, Watershed or any carbon vendor. Ledgerleaf has its own name, mark and illustrations; factors and companies are invented.
Moodboard references
From grey tables to a report a buyer will accept.
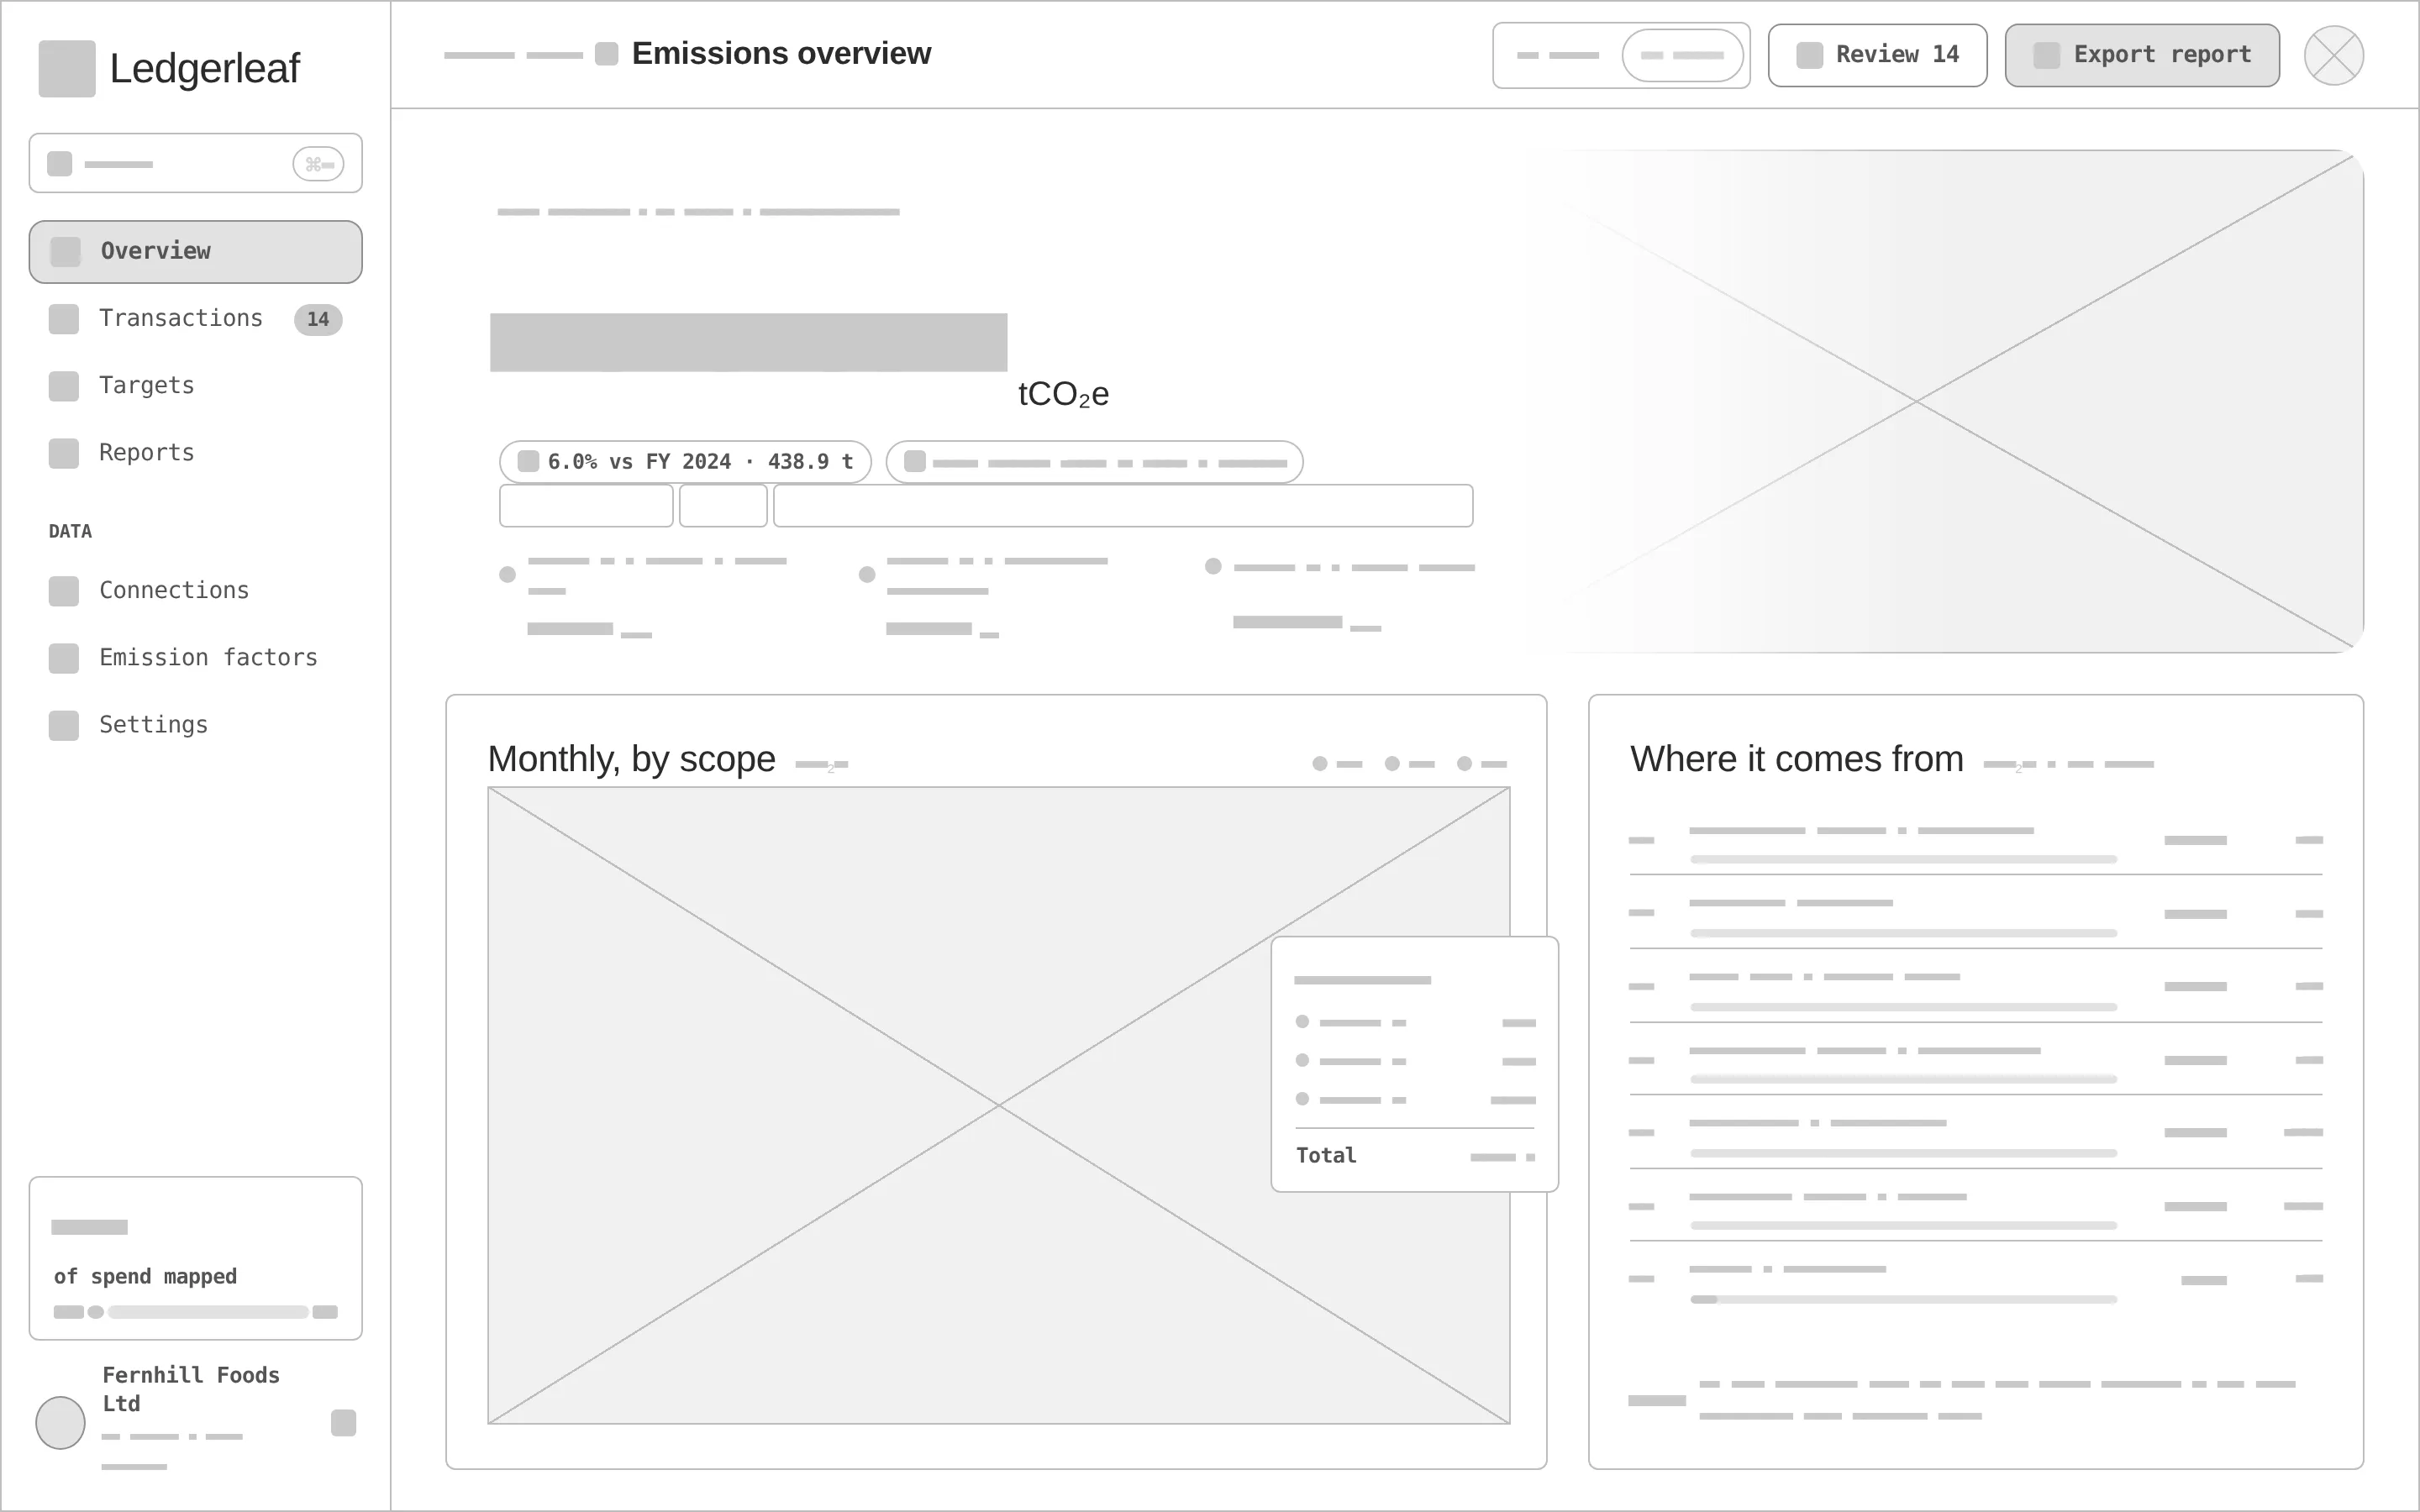
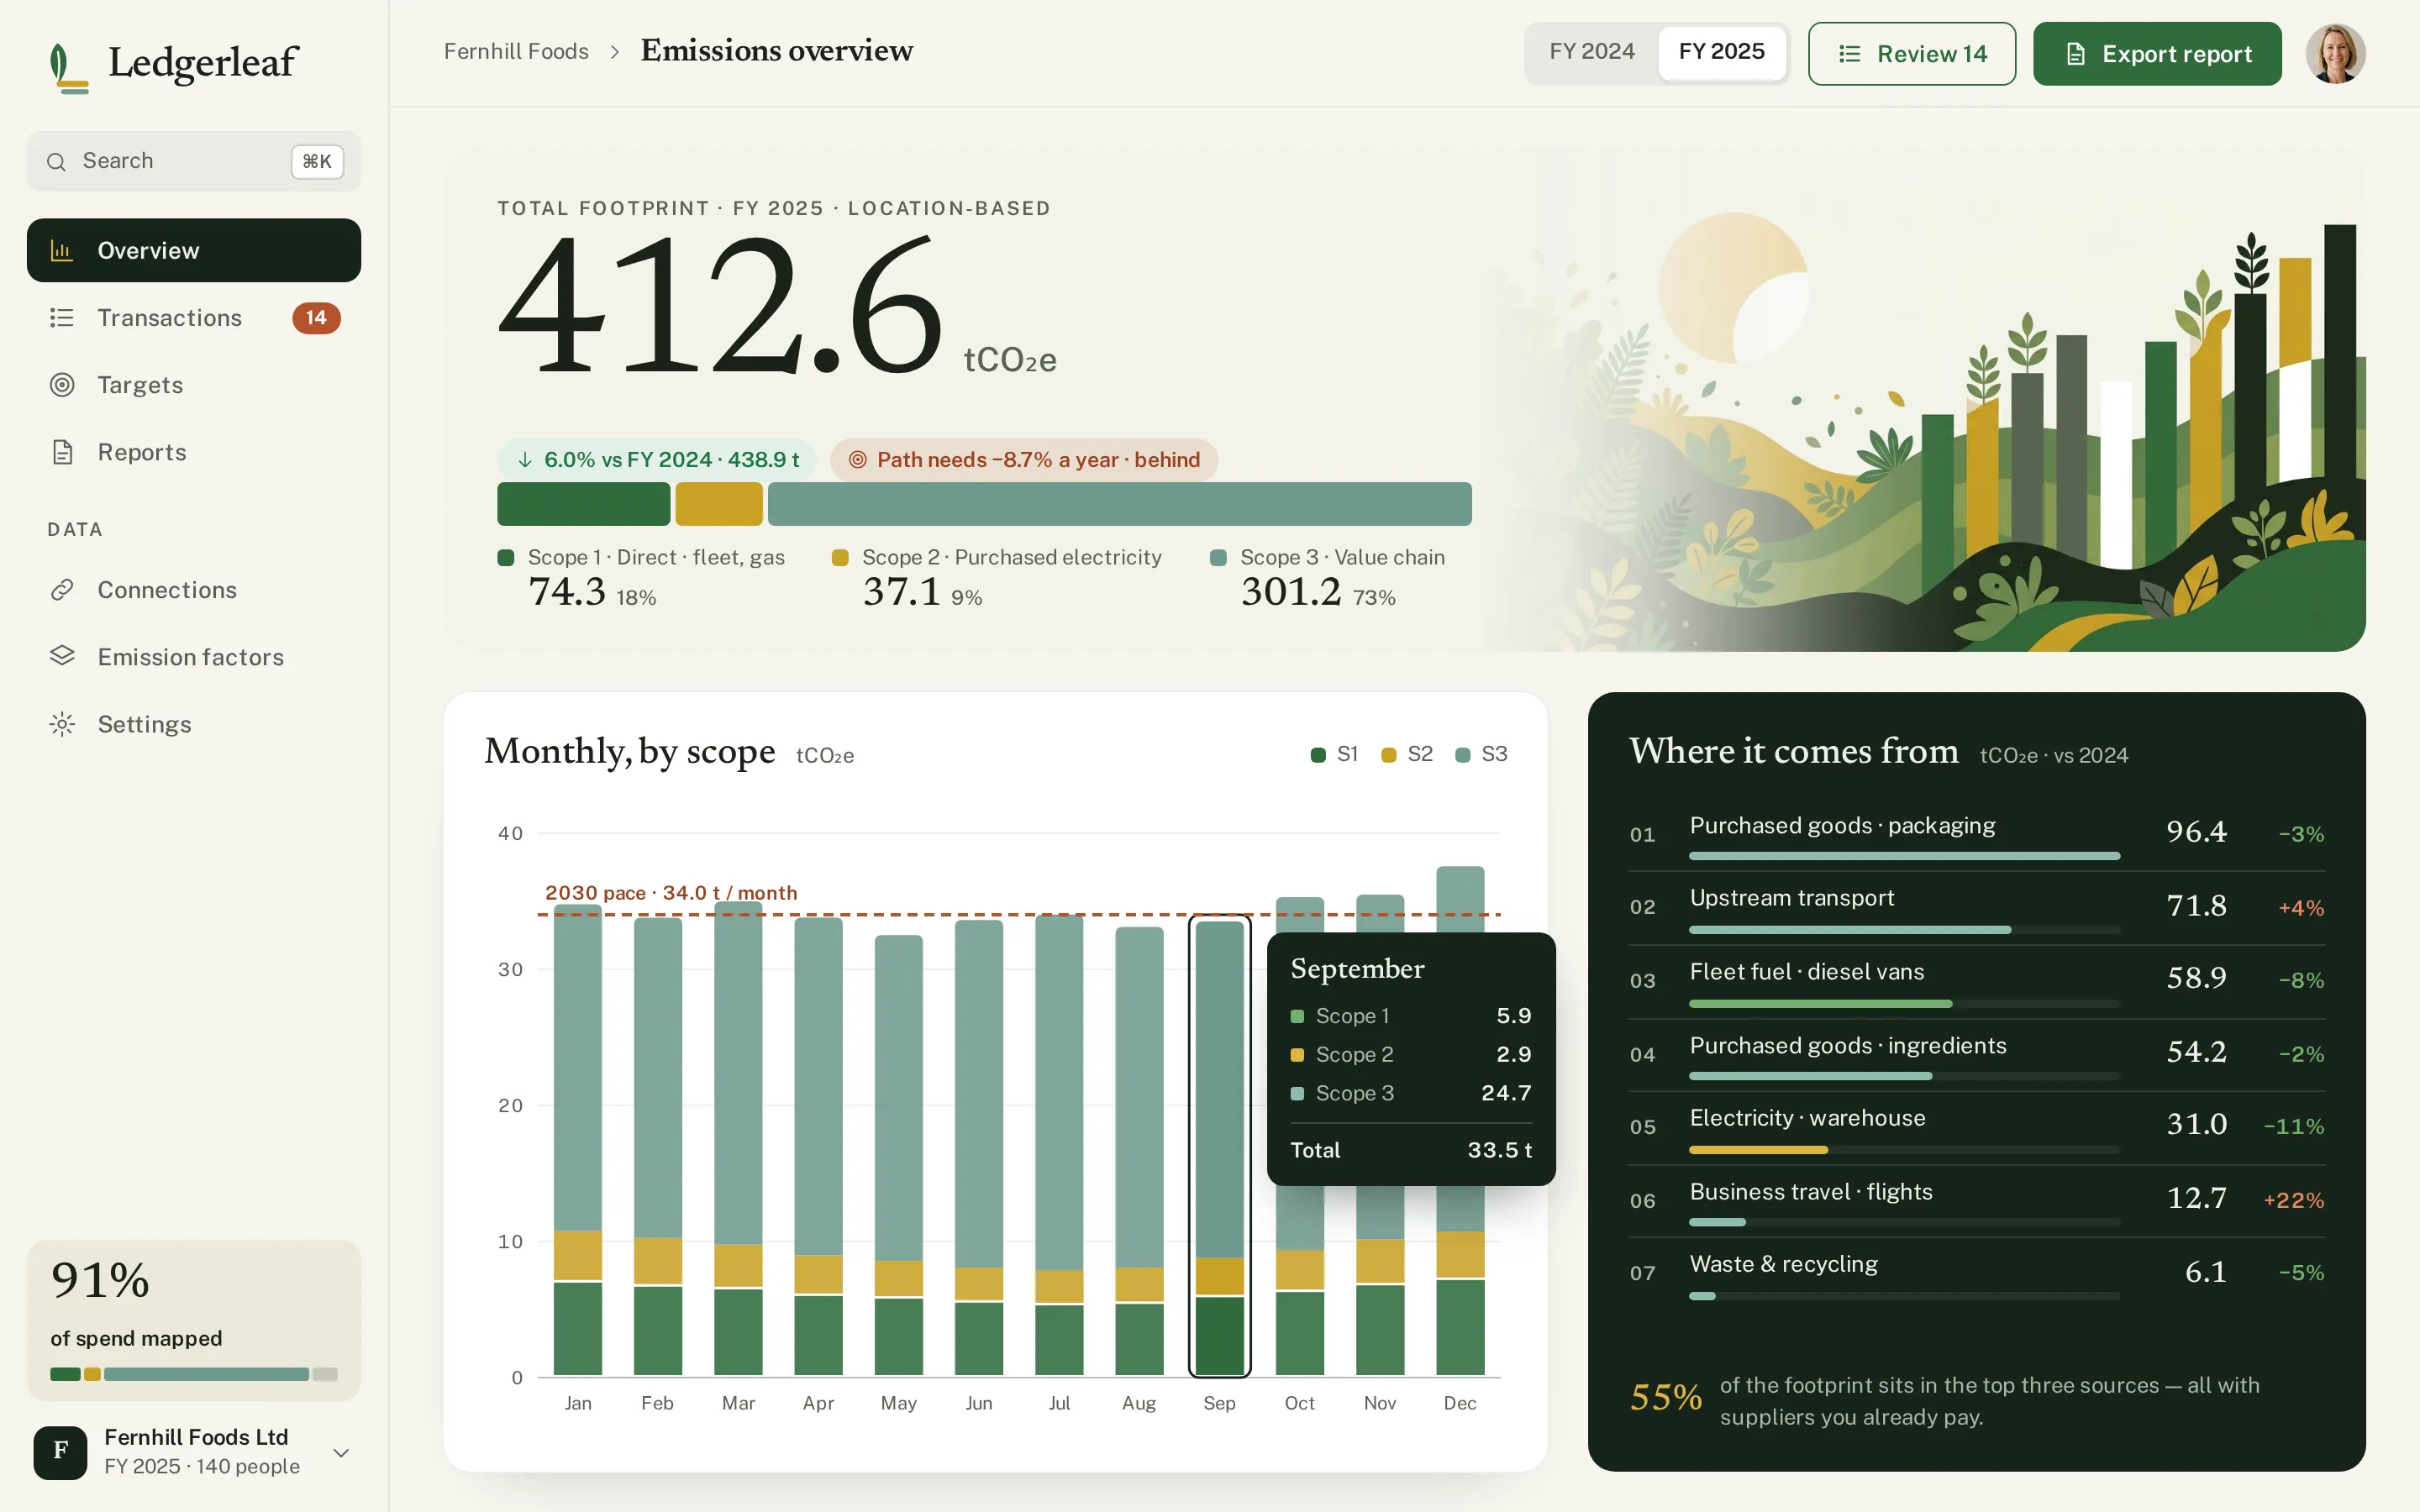
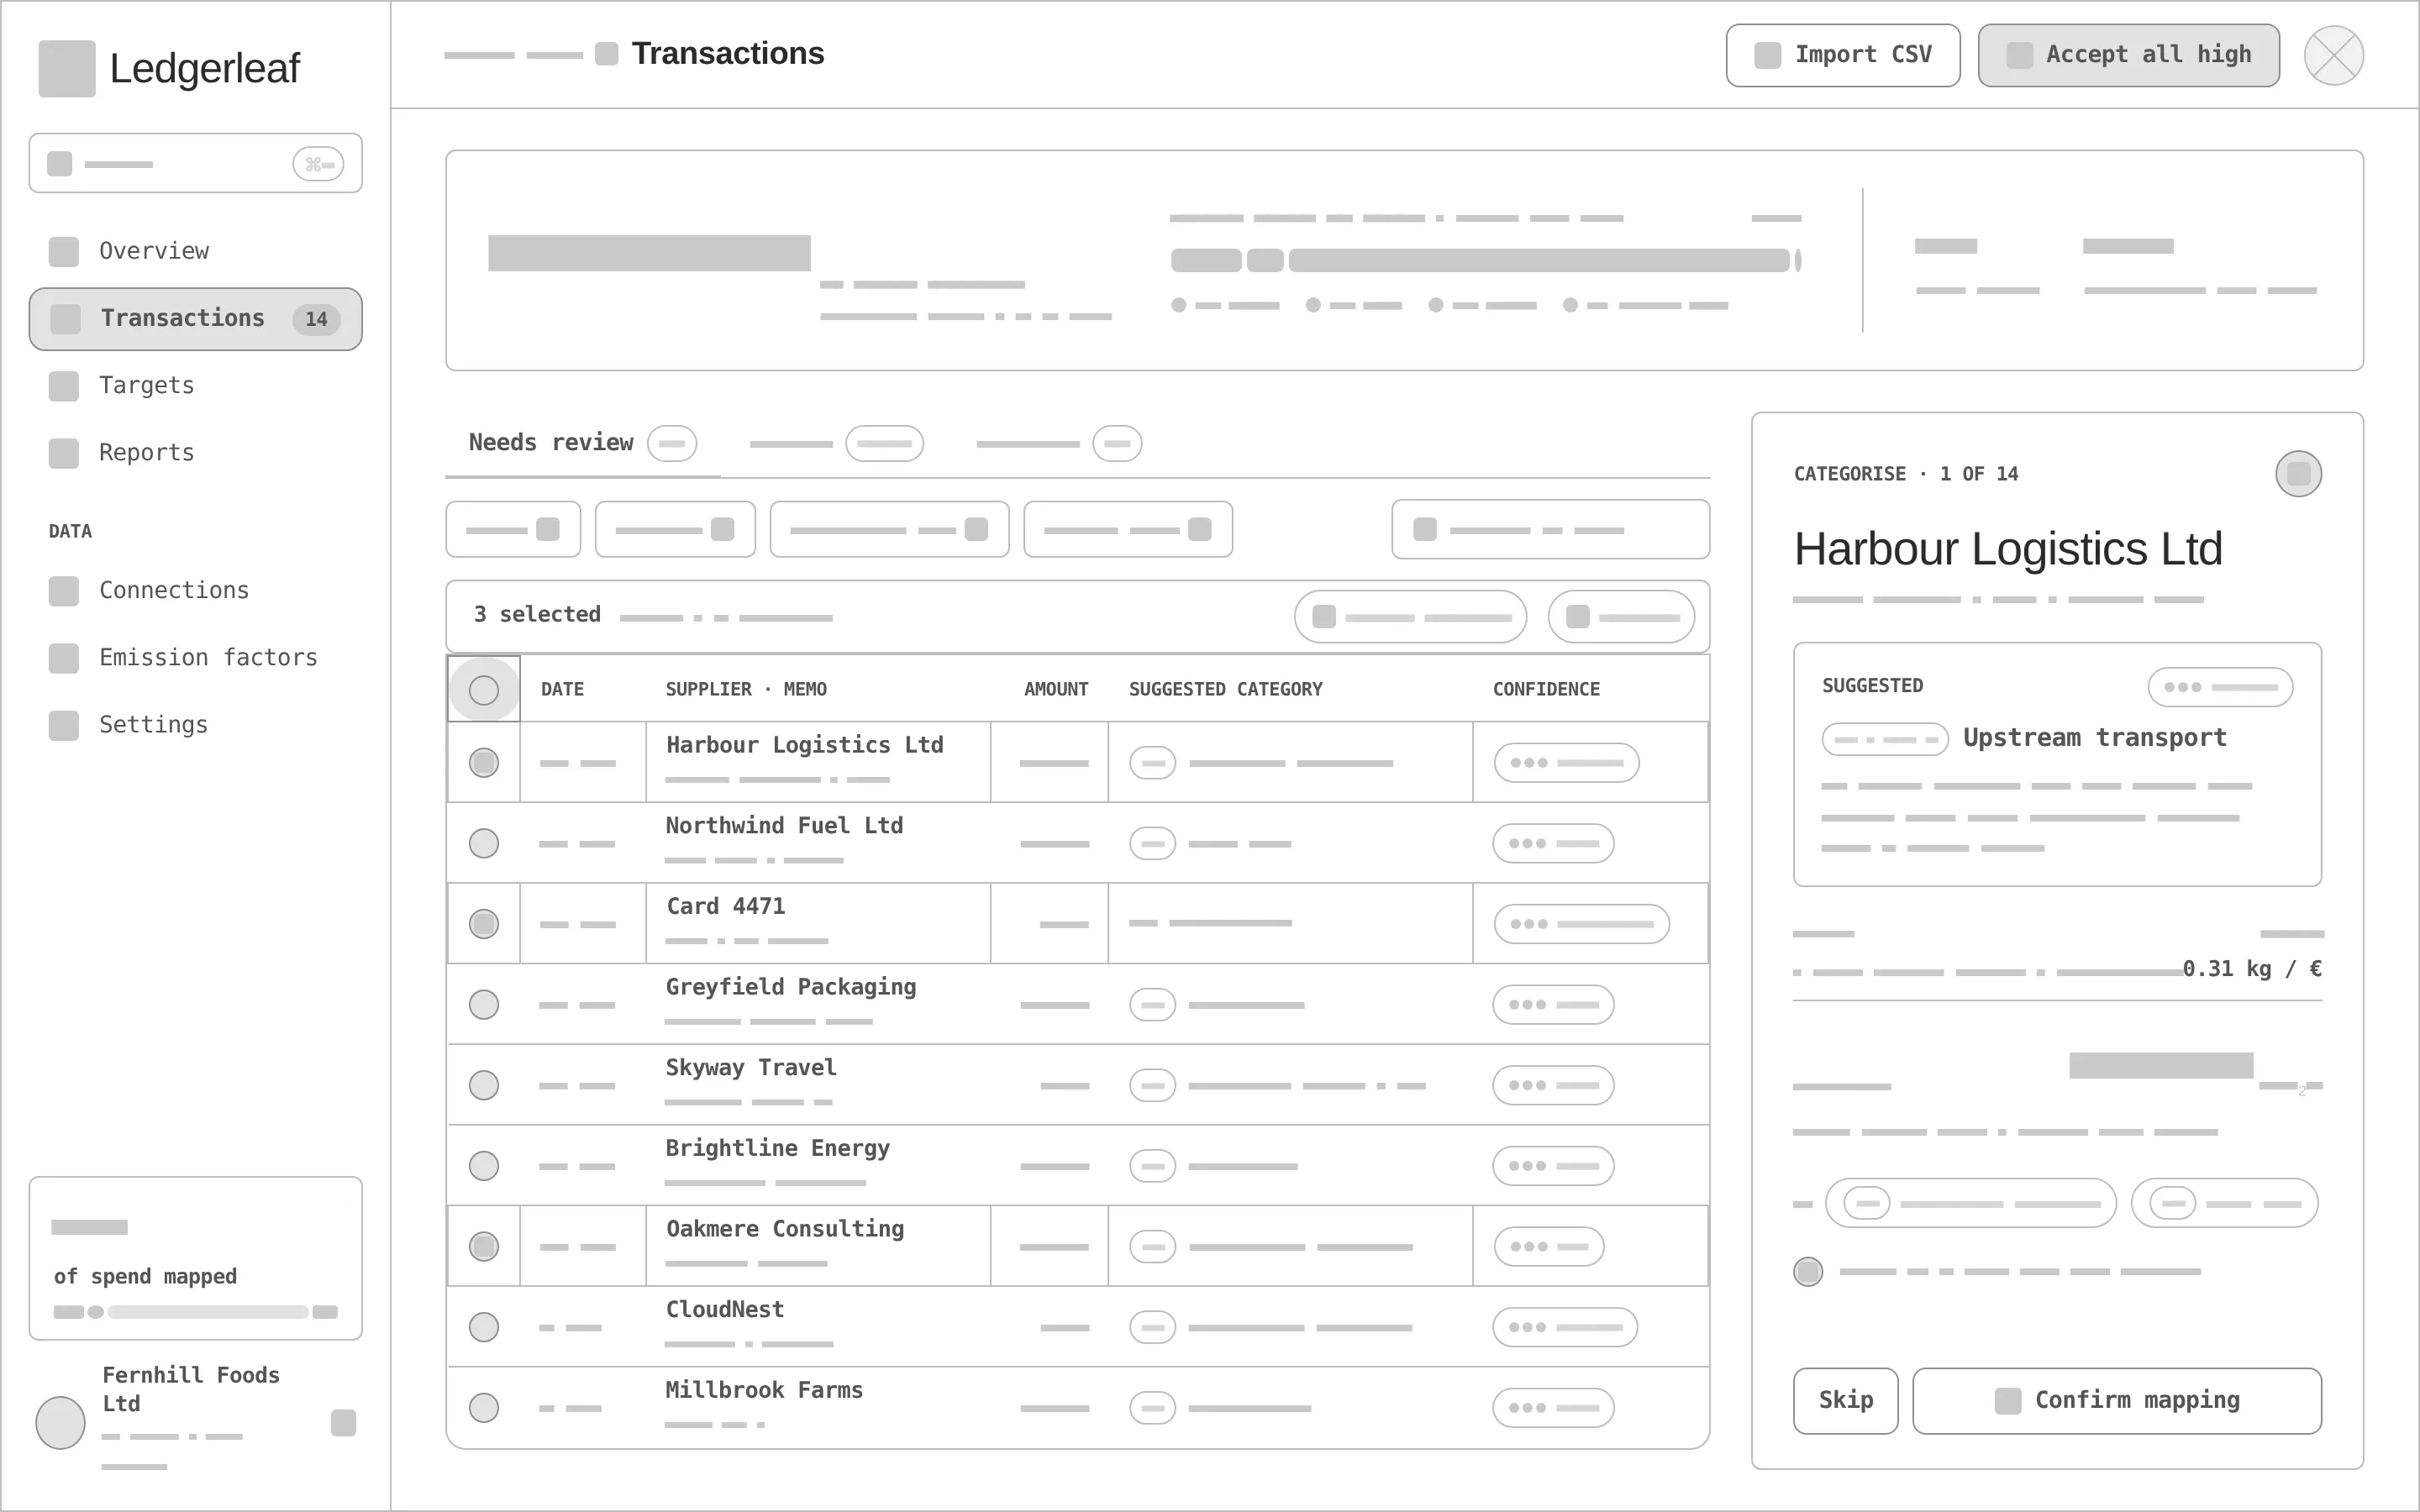
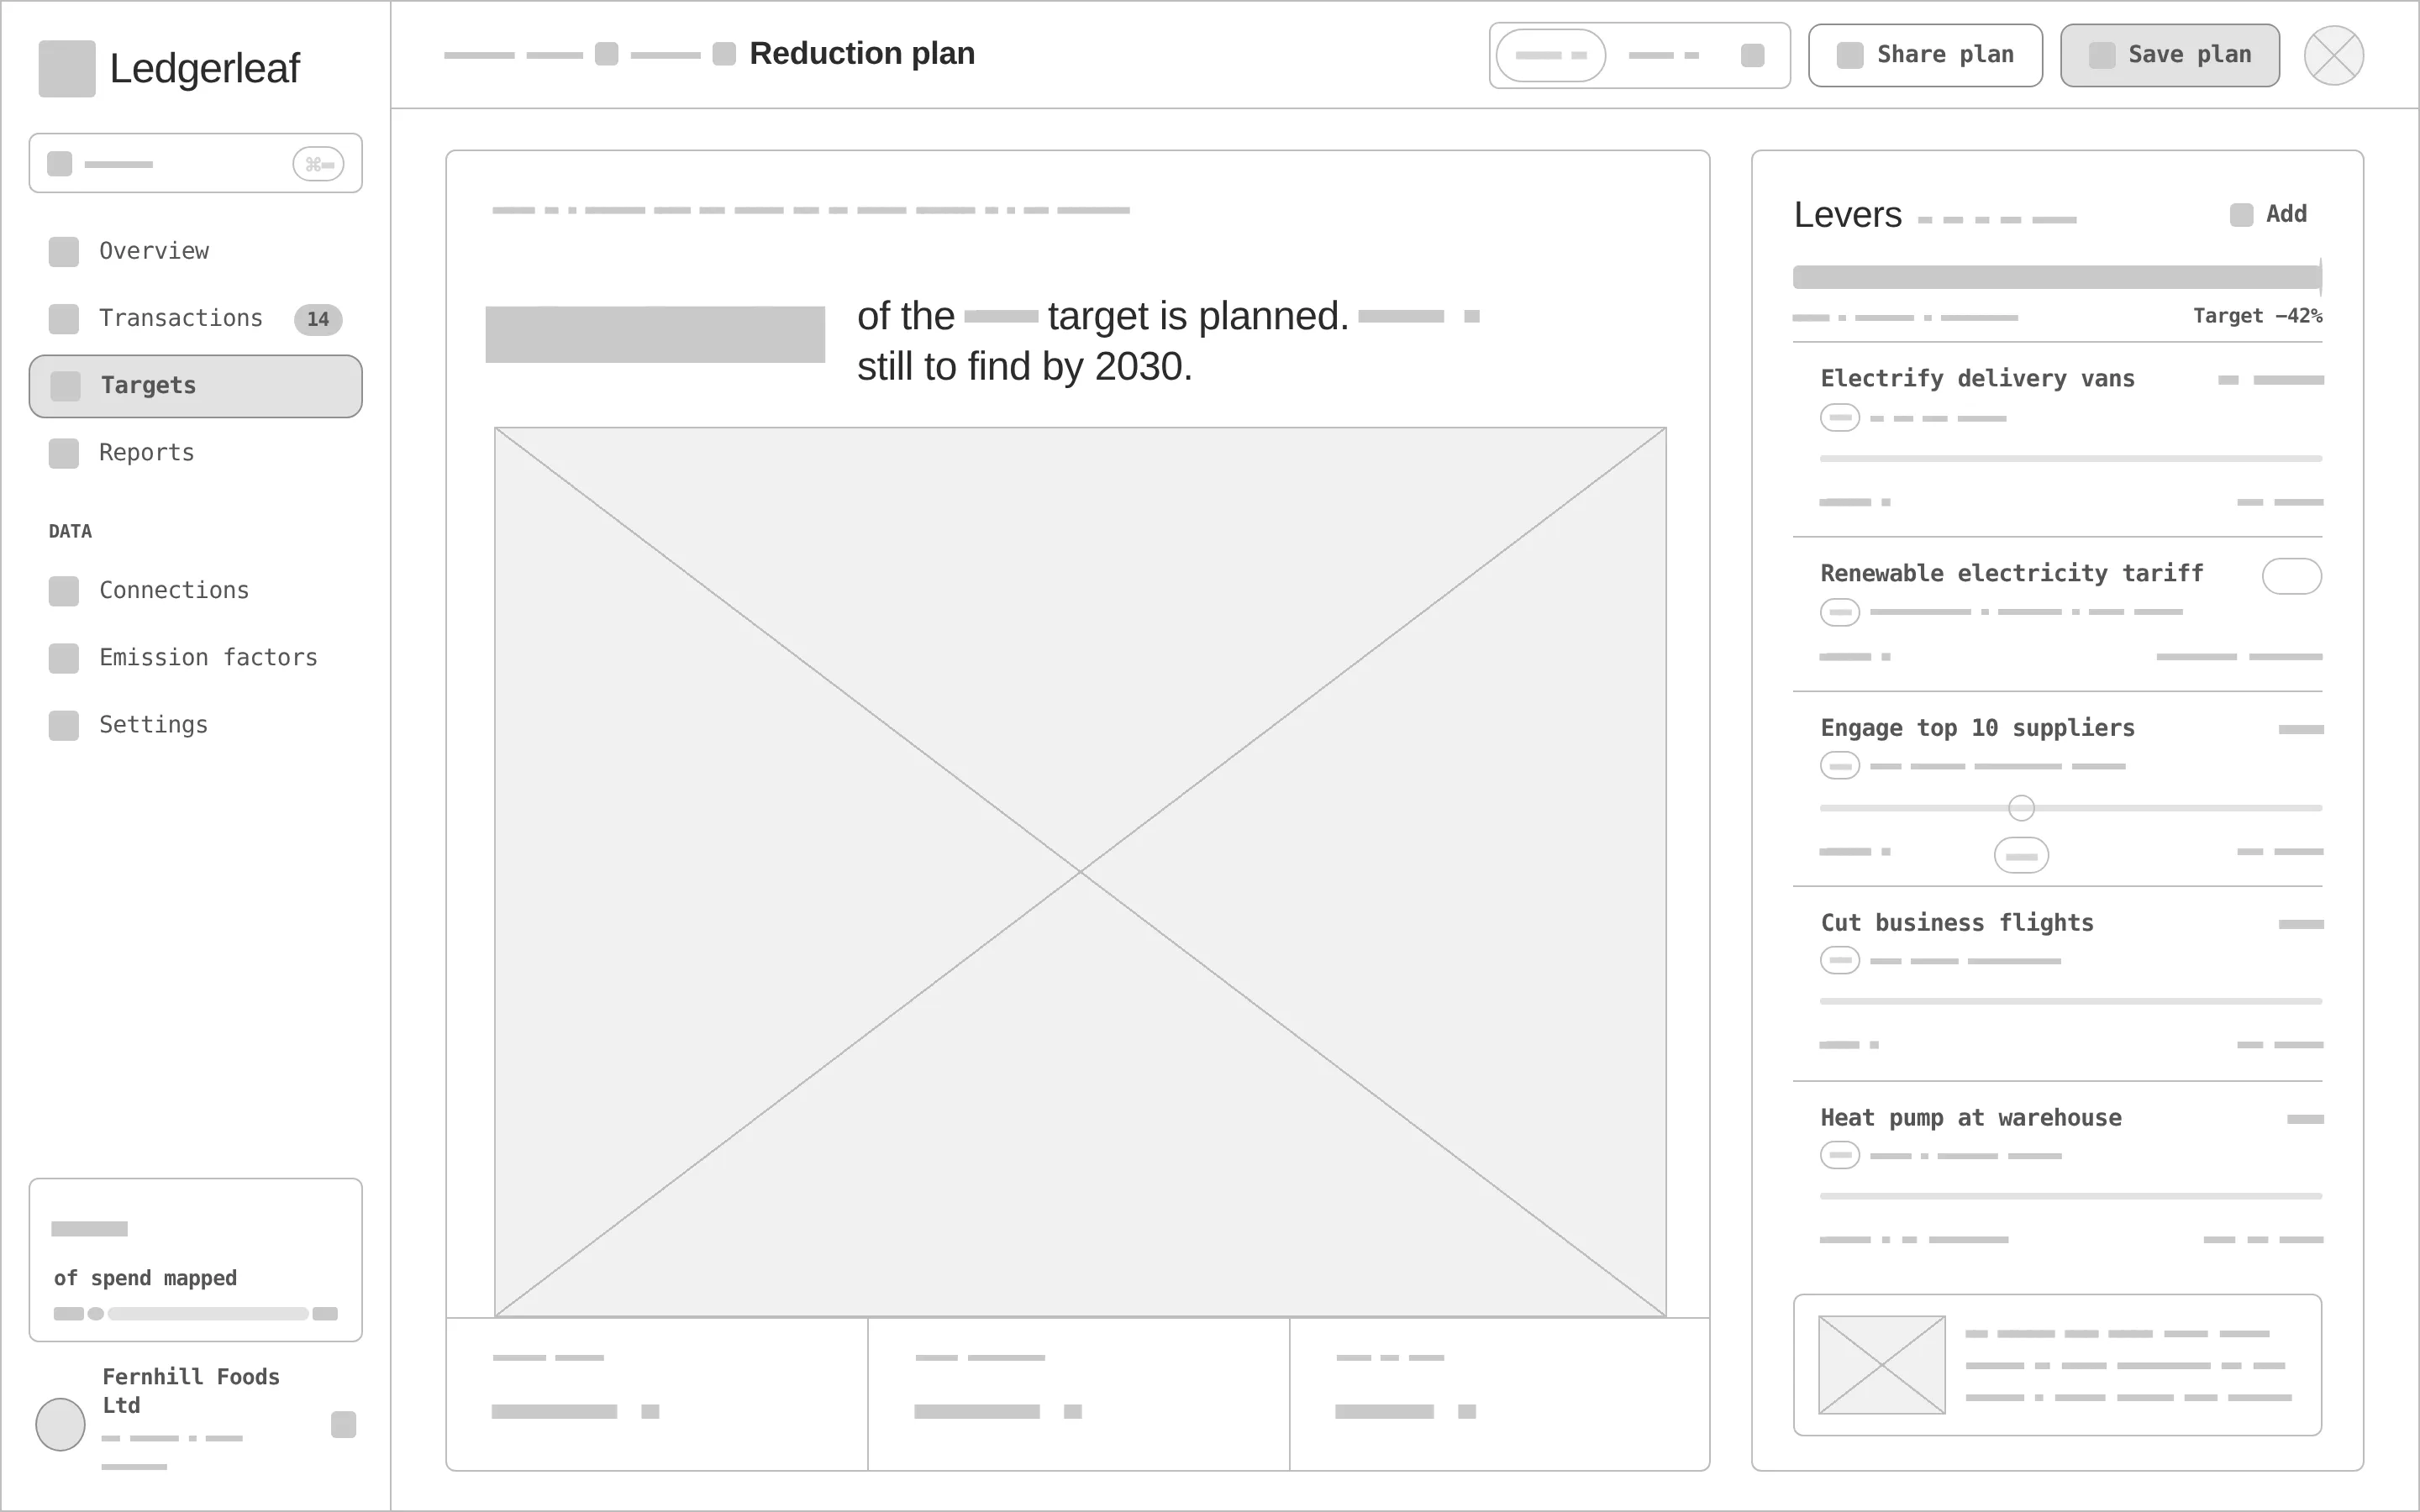
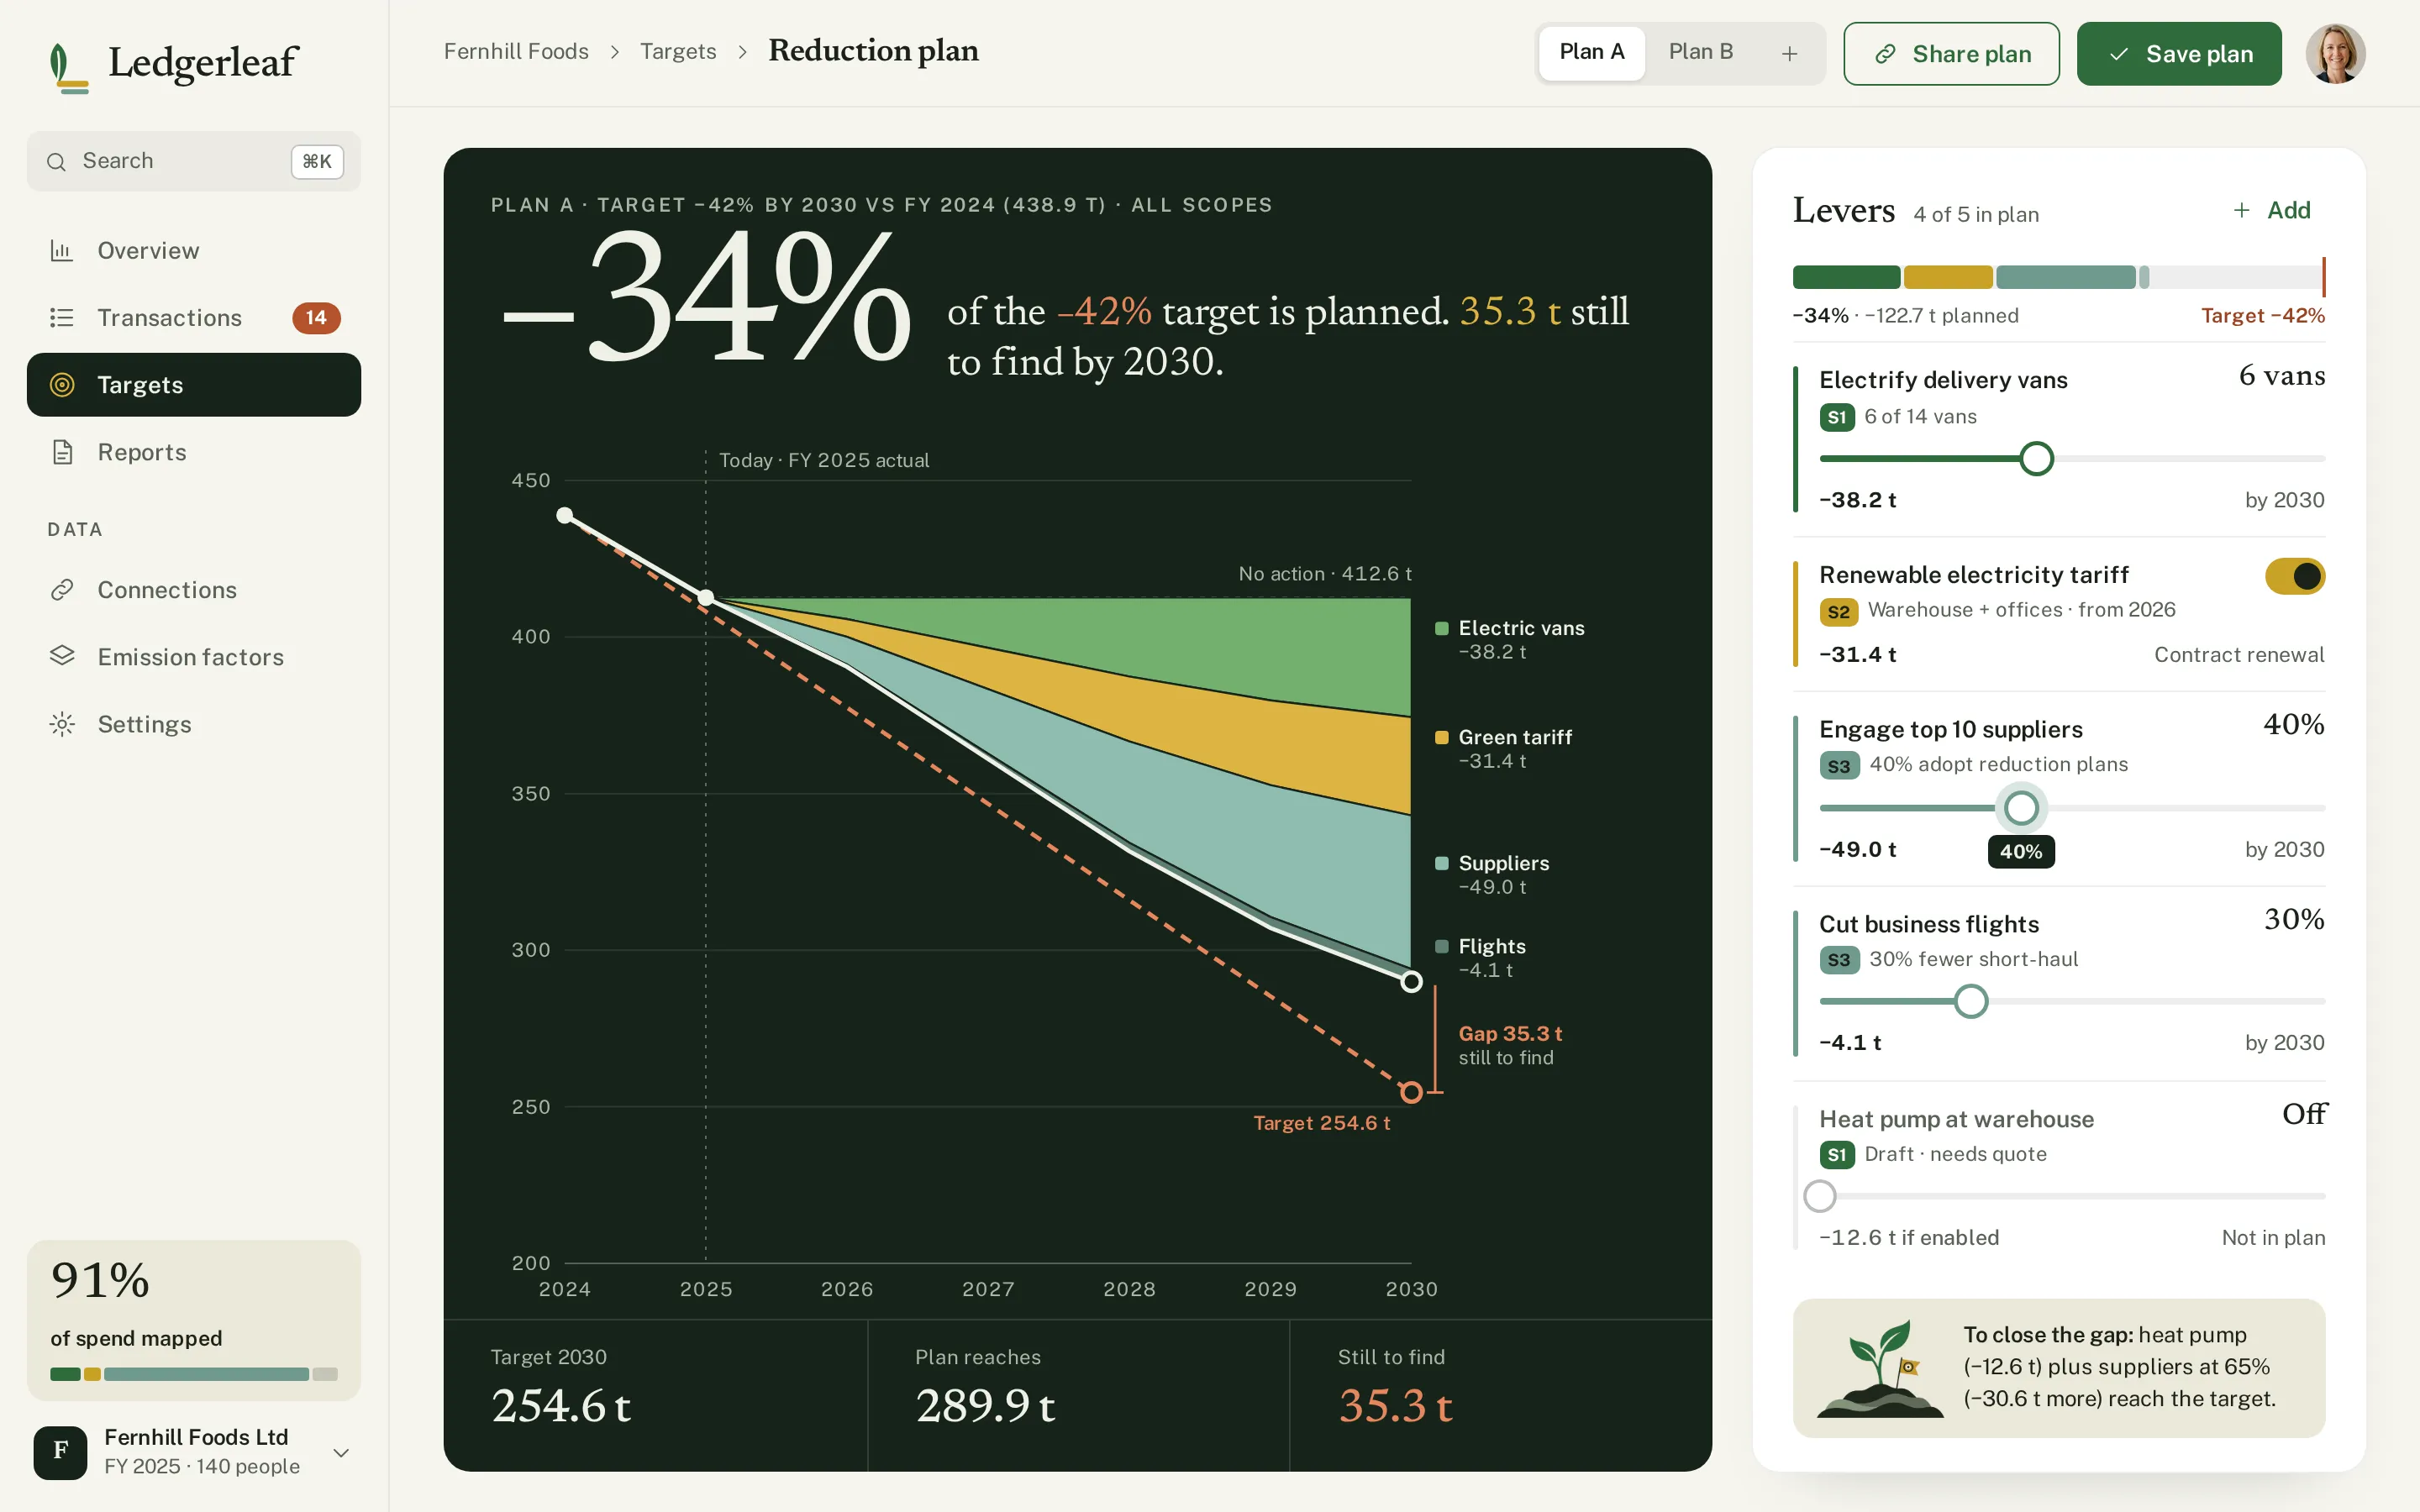
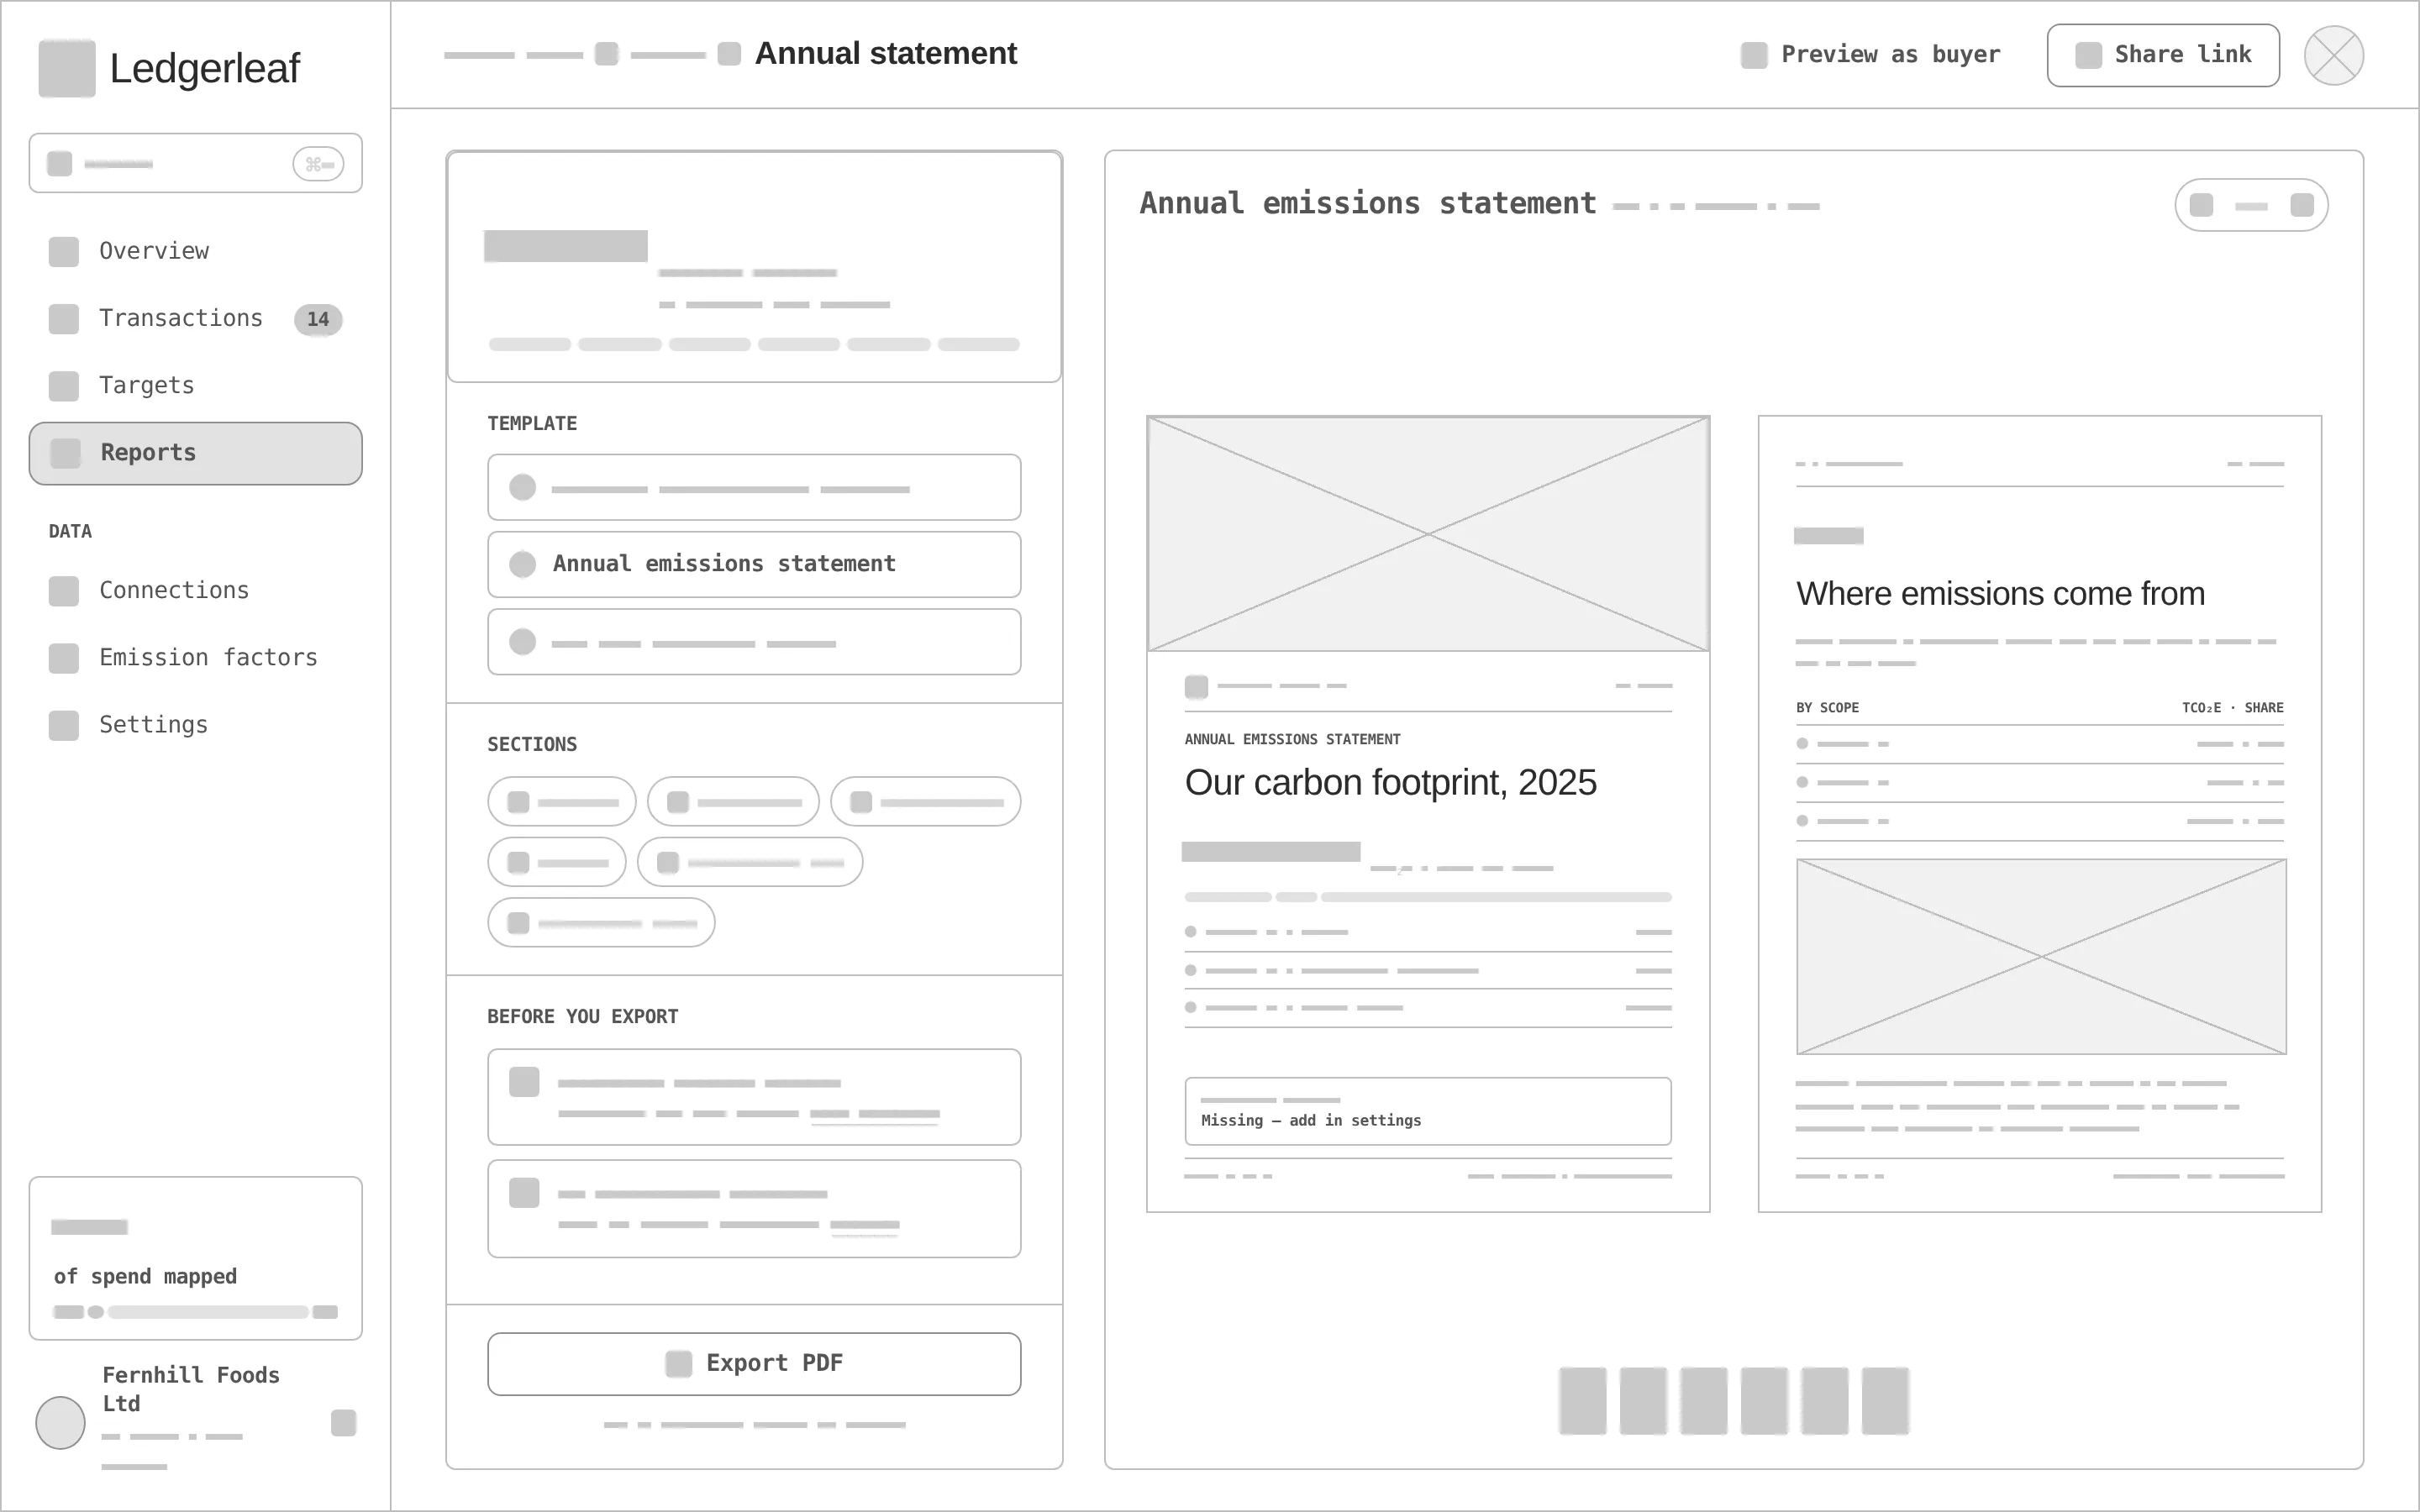
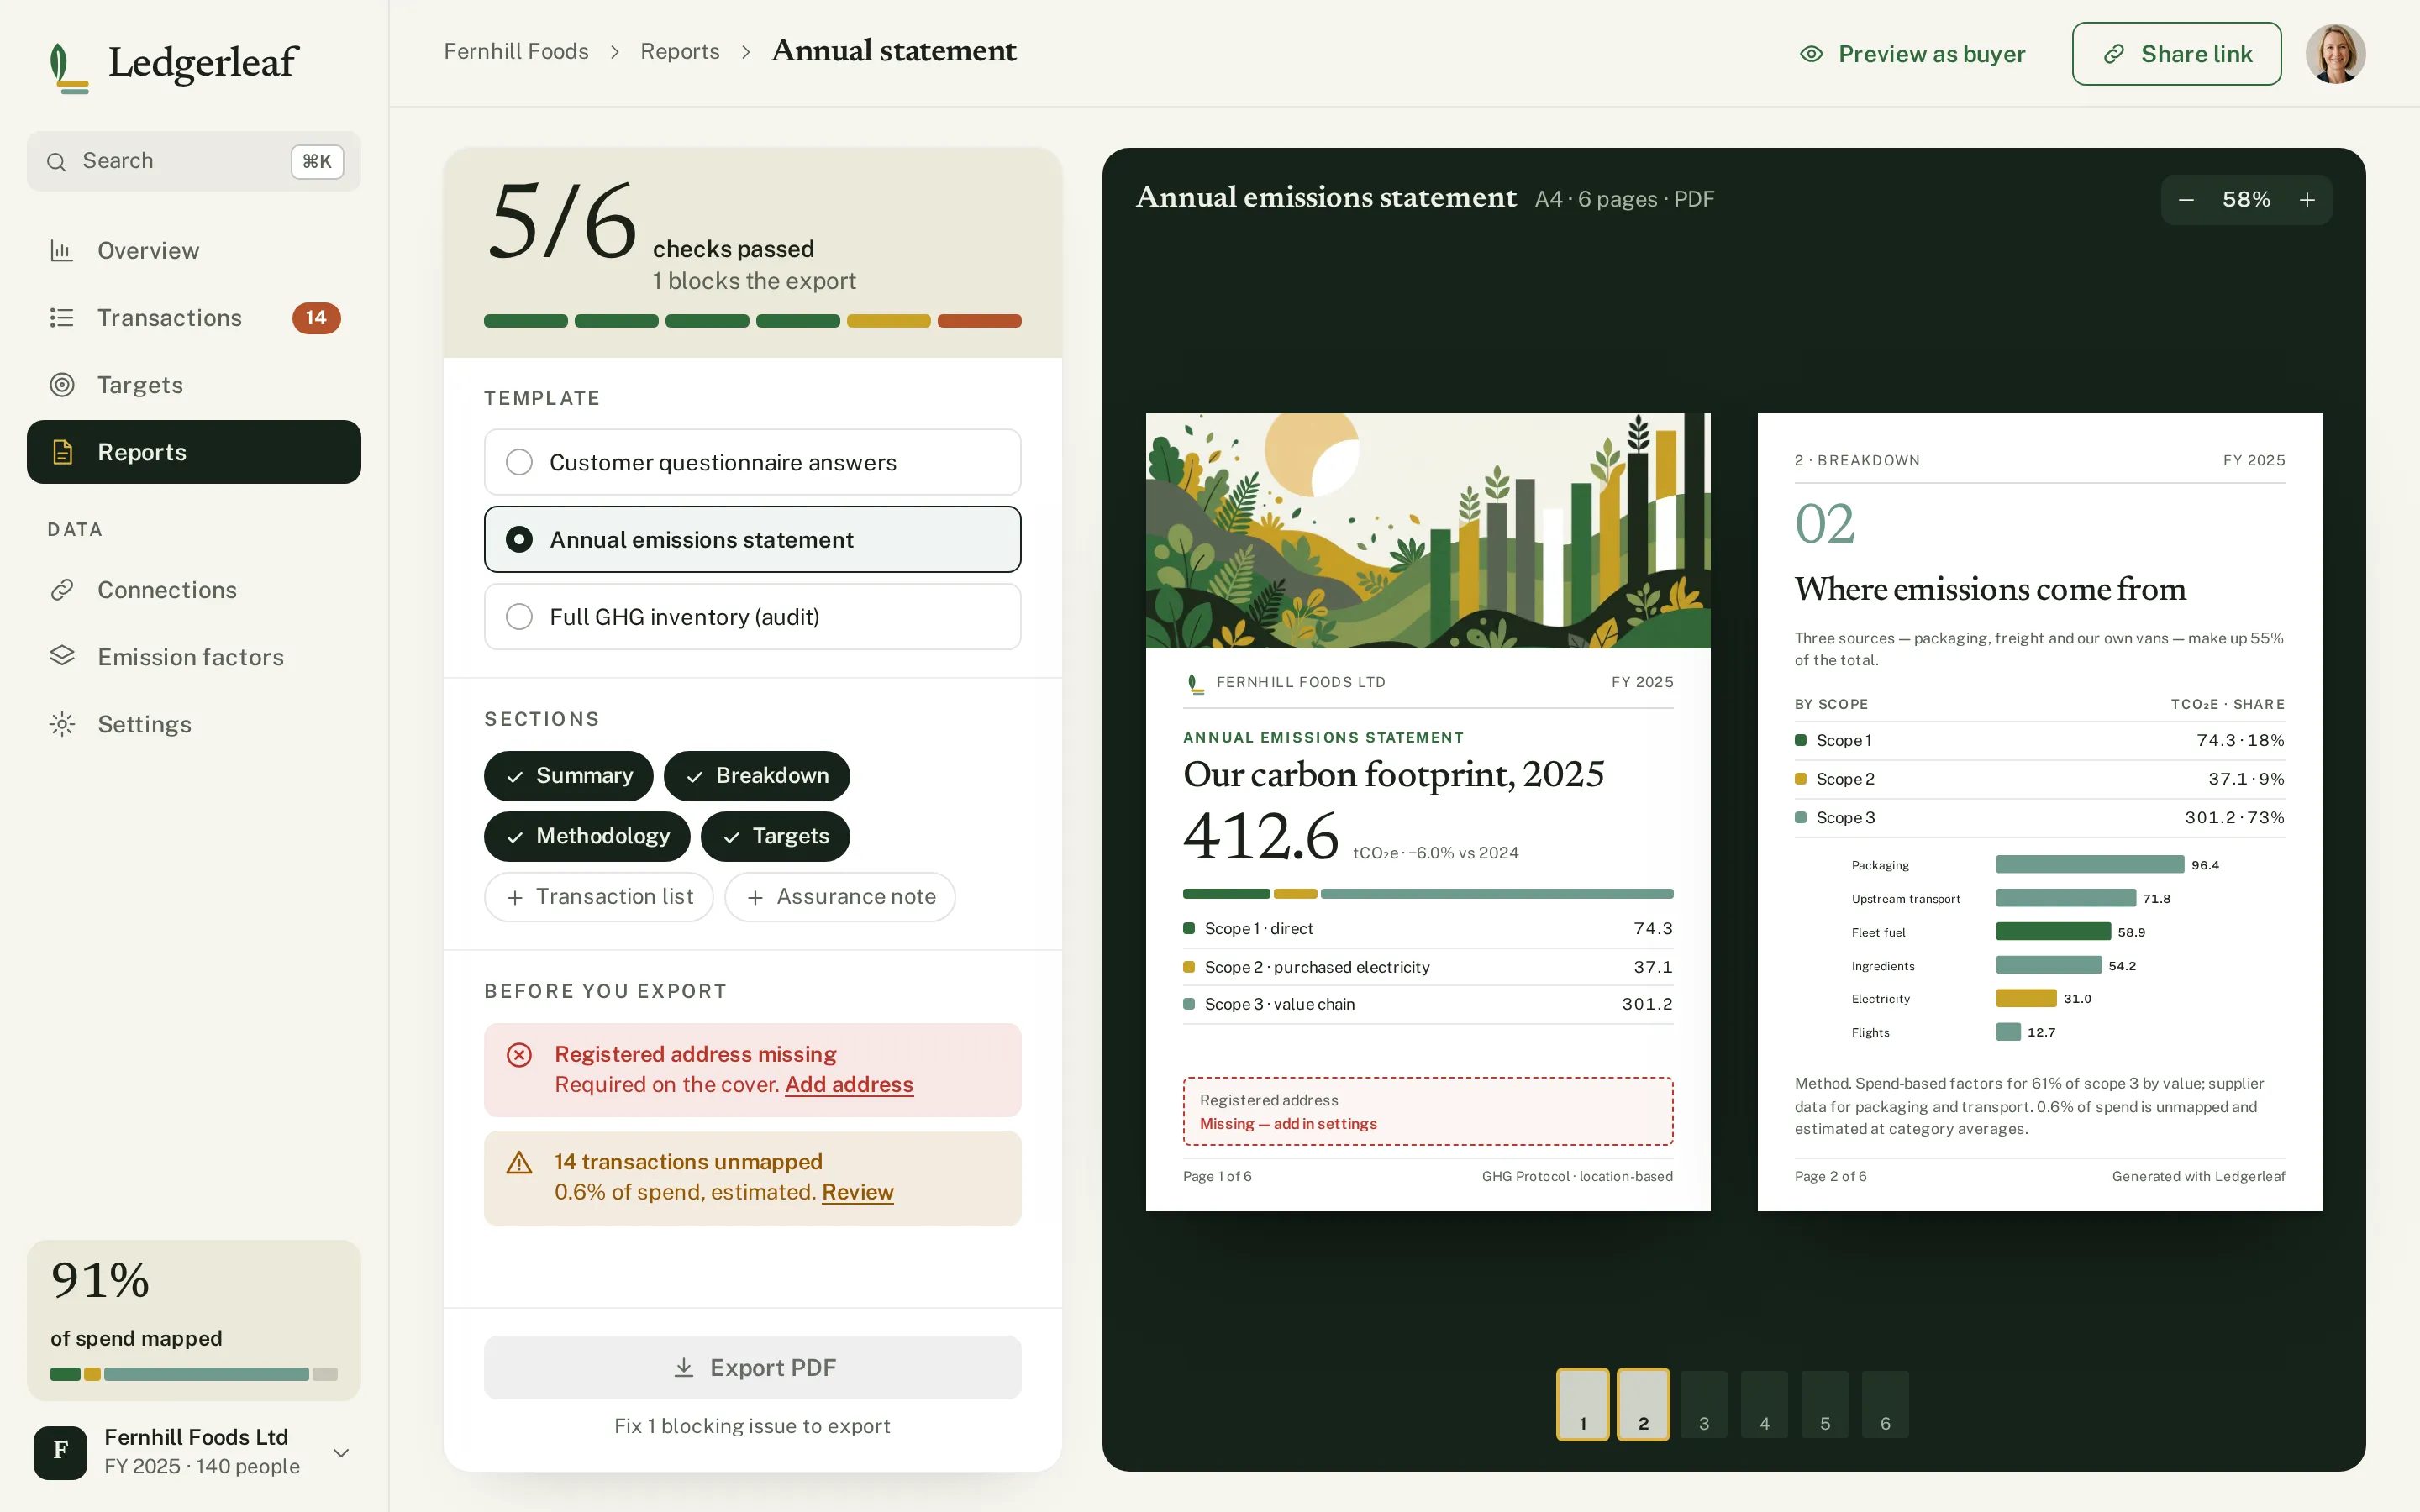
Every «before» is generated from the very same screen markup, reduced to outlines, readable labels and grey word-bars — no colour, illustration or chart fills. Drag a handle to compare.
- 01
Hierarchy
One display number per screen — 412.6 t, 2,170 resolved, −34 %, 5/6 checks — with everything else subordinate to it.
- 02
Grid & density
A narrow sidebar and a wide canvas; dense table rows where people map invoices, wide sentence headlines where they decide.
- 03
States
High / medium / low confidence, unmapped rows, bulk selection, a lever switched off, a plan that misses the target by 35.3 t, a blocking issue before export.
- 04
Data that reconciles
The «no action» path holds at FY 2025 so the lever wedges add up exactly to the plan (289.9 t); v1 showed a rising line that did not.
- 05
Assets
Three illustrations made for the concept: the overview hero that doubles as the report cover, a sprout for the plan tip and empty state, and an «export done» scene.
- 06
Real-looking data
Suppliers, invoice numbers, spend-based factors, months by scope and a six-page statement — real lengths test every row.
A second pass: v1 read as an admin template.
The first hi-fi version was correct but flat — identical white cards on beige, one green in three tints, no hero, default charts. We collected new references for mood and technique only and redesigned all four screens around four devices: a typographic KPI hero, three scope hues plus clay for targets, tonal layering instead of card-in-card, and editorial charts with direct labels. Drag to compare v1 with v2.
- 01
Typographic KPI hero
One Newsreader number at 72–116 px per screen with a small caption — the hero of the block, borrowed as a device, not a layout.
- 02
Three scope hues + clay
Fern for Scope 1, ochre for Scope 2, sage-teal for Scope 3 — the same hues in ribbon, bars, tags and lever stripes; clay marks targets and gaps only.
- 03
Tonal layering
A dark forest panel for the one story block per screen, linen bands for summaries, white only for «paper» — tables and report pages.
- 04
Editorial charts
Direct labels instead of legends, a ranked list 01–07, a wedge chart for the plan and the illustration blended into the hero.
Recycled paper, fern ink and an ochre stamp.
Fern carries actions and Scope 1 (6.4:1 with white text); ochre is a 2.21:1 accent — Scope 2 fills and the logo's ledger lines, never text. The v2 system adds forest panels, sage-teal for Scope 3 and clay for targets. Newsreader sets the numbers and headlines, Public Sans the interface.
A leaf as the stem of an «L», with ledger lines as its foot in ochre and sage. Variant 2 of a grid of four directions, redrawn as a vector that reads at 24 px.
#2F6B3B
vs bg 5.85:1 · label 6.39:1
#C9A227
on bg 2.21:1
#1A2118
on bg 15.08:1
#F6F5EF
text on it 15.08:1
#FFFFFF
text on it 16.48:1
#5A6356
on bg 5.73:1
Accent / bg 2.21:1 — ochre is for Scope 2 fills and the ledger lines of the mark, never for text or signal icons.
Newsreader 500Ledgerleaf
Newsreader 500Finance/ops leads at 20–500-person companies asked by customers for emissions data
Public Sans 400 · 16/26Carbon accounting a small company can actually finish: connect invoices, auto-map to Scope 1-3, set a target and export a buyer-ready report.
Public Sans 600 · 12climate / carbon accounting for SMEs
Four screens from the first invoice to the signed-off report.
Transaction mapping
2,170 of 2,184 resolved with a coverage ribbon by scope, the review table with bulk actions and a dark decision panel that shows the factor and the result as an equation.
Wedge chart
Each lever is a wedge in its scope colour; what is left is the clay gap to the target.
Decision panel
Spend × factor = tonnes, with the confidence and two alternatives one tap away.
Reduction plan
−34 % of the −42 % target in one sentence, a wedge chart from «no action» to the plan with the gap to target, and levers with scope stripes and sliders.
Report export
Readiness 5/6 with one blocking issue, template and sections, and the first two pages of the statement on a dark desk.
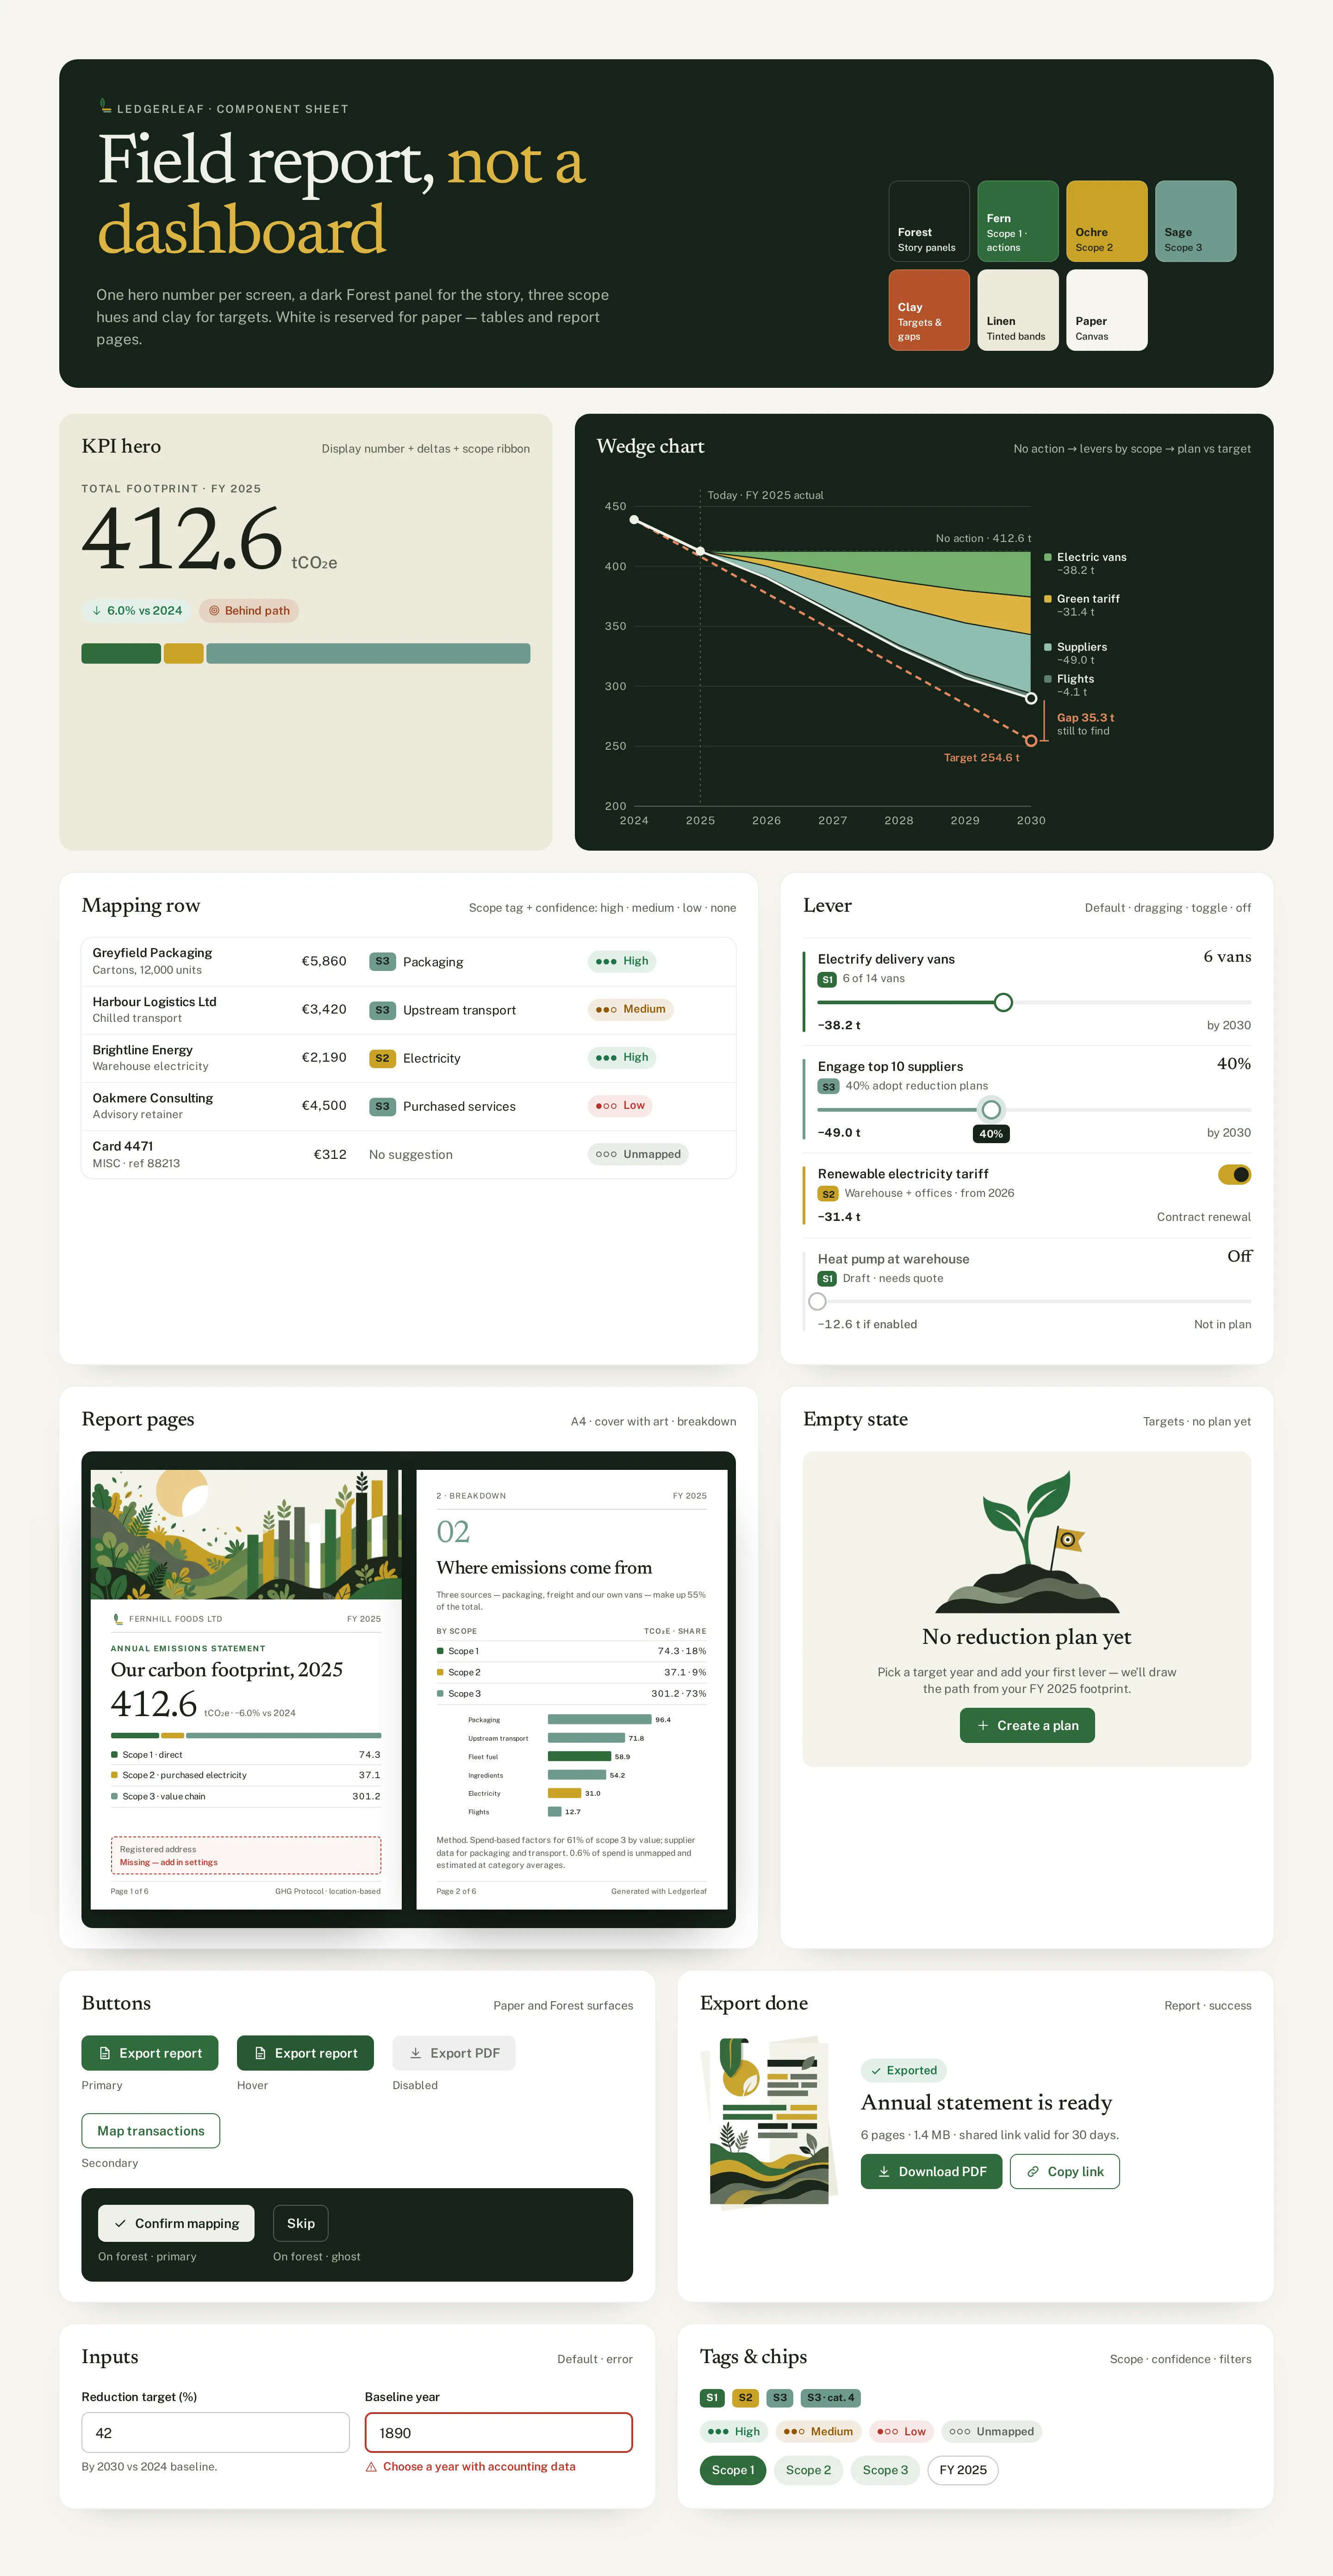
Component sheet
Forest header with seven swatches, the KPI hero, wedge chart, mapping row, lever, report pages, empty state with the sprout, export done, buttons on paper and on forest, inputs and scope tags.
TrustworthyNaturalEditorial
Questions & answers
Is Ledgerleaf a real product?
No. Ledgerleaf is a self-initiated concept by Omnisense — a brief we set ourselves, with no client and no business metrics. The emission factors and companies in the screens are invented.
Who is Ledgerleaf for?
Finance and operations leads at 20–500-person companies whose customers now ask for emissions data — people who know invoices, not climate science.
How are invoices turned into emissions?
Every invoice is mapped to Scope 1–3, and each decision shows its working as a typographic equation — amount × emission factor = tonnes — with confidence dots on every row.
What is the end result?
A report a customer will accept. The export runs readiness checks first, so you know what is missing before you send it.
What did you design?
An emissions overview, transaction mapping with a decision panel, a reduction plan with levers and a wedge chart, and the report export with readiness checks — plus the component sheet, logo, palette and type system.