 Case 13 / 28
2026
Voltyard
Every van charged by 06:00 — at the cheapest hour the grid allows.
Depot command center for electric delivery fleets: charging schedule vs routes, battery health and energy cost per delivery.
A self-initiated concept, designed like a real product.
The brief we set ourselves
Design a depot command centre for electric delivery fleets: which van charges where and when, which will miss its departure, and what each delivery costs in energy.
Who it is for
Fleet and depot managers at last-mile logistics companies — the night-shift lead who has 40 vans, 12 chargers and a grid cap of 900 kW.
What we designed
The depot overview with charger bays, tonight's charging plan as a Gantt against departures, a live route map in dark ops-mode and the monthly energy & cost report.
Design facts from the concept files — not business results.
02ResearchElectric fleets are here. Depots still plan charging on a whiteboard.
We checked how fast electric trucks are being adopted, how the charging network is maturing, and what broad telematics products show — then cut the scope down to one job: the night at the depot.
We checked how fast electric trucks are being adopted, how the charging network is maturing, and what broad telematics products show — then cut the scope down to one job: the night at the depot.
- Adoption
Electric trucks reached about 9% of truck sales in 2025 — over 400,000 vehicles, double the year before (IEA).
DecisionDesign for a depot already running dozens of electric vans: the unit of the interface is a van with a departure time, not a single car.
- Infrastructure
Public charging grew by a third in 2025 to about 7 million points — but delivery fleets still charge at their own depot, overnight.
DecisionThe core screen is tonight's plan: charging sessions against departures, peak-tariff hours shaded, the grid cap drawn on the site load.
- Scope
Telematics platforms such as Samsara cover the whole fleet — tracking, safety, maintenance — and depot charging is one tab among many.
DecisionDo one job deeply: risk-first lists («VAN-07 may miss 05:40»), one-click fixes («Move to C-01 · 150 kW») and cost per delivery.
Patterns we borrowed
- Samsara
- Only the scope of fleet operations as a reference; no screens or visuals audited or reused
- Project planning tools
- A Gantt with a now-line, here against each van's departure marker
- Network ops consoles
- A dark ops-mode for the live map — high-contrast routes at night
- Energy dashboards
- Tariff bands and site load with a cap line
What we left out
Logos, screens and copy of Samsara or any charger maker, and real depot locations. Voltyard has its own name and mark, and the city on the map is invented.
Moodboard references
From tables of vans to a plan you can read at 2 a.m.
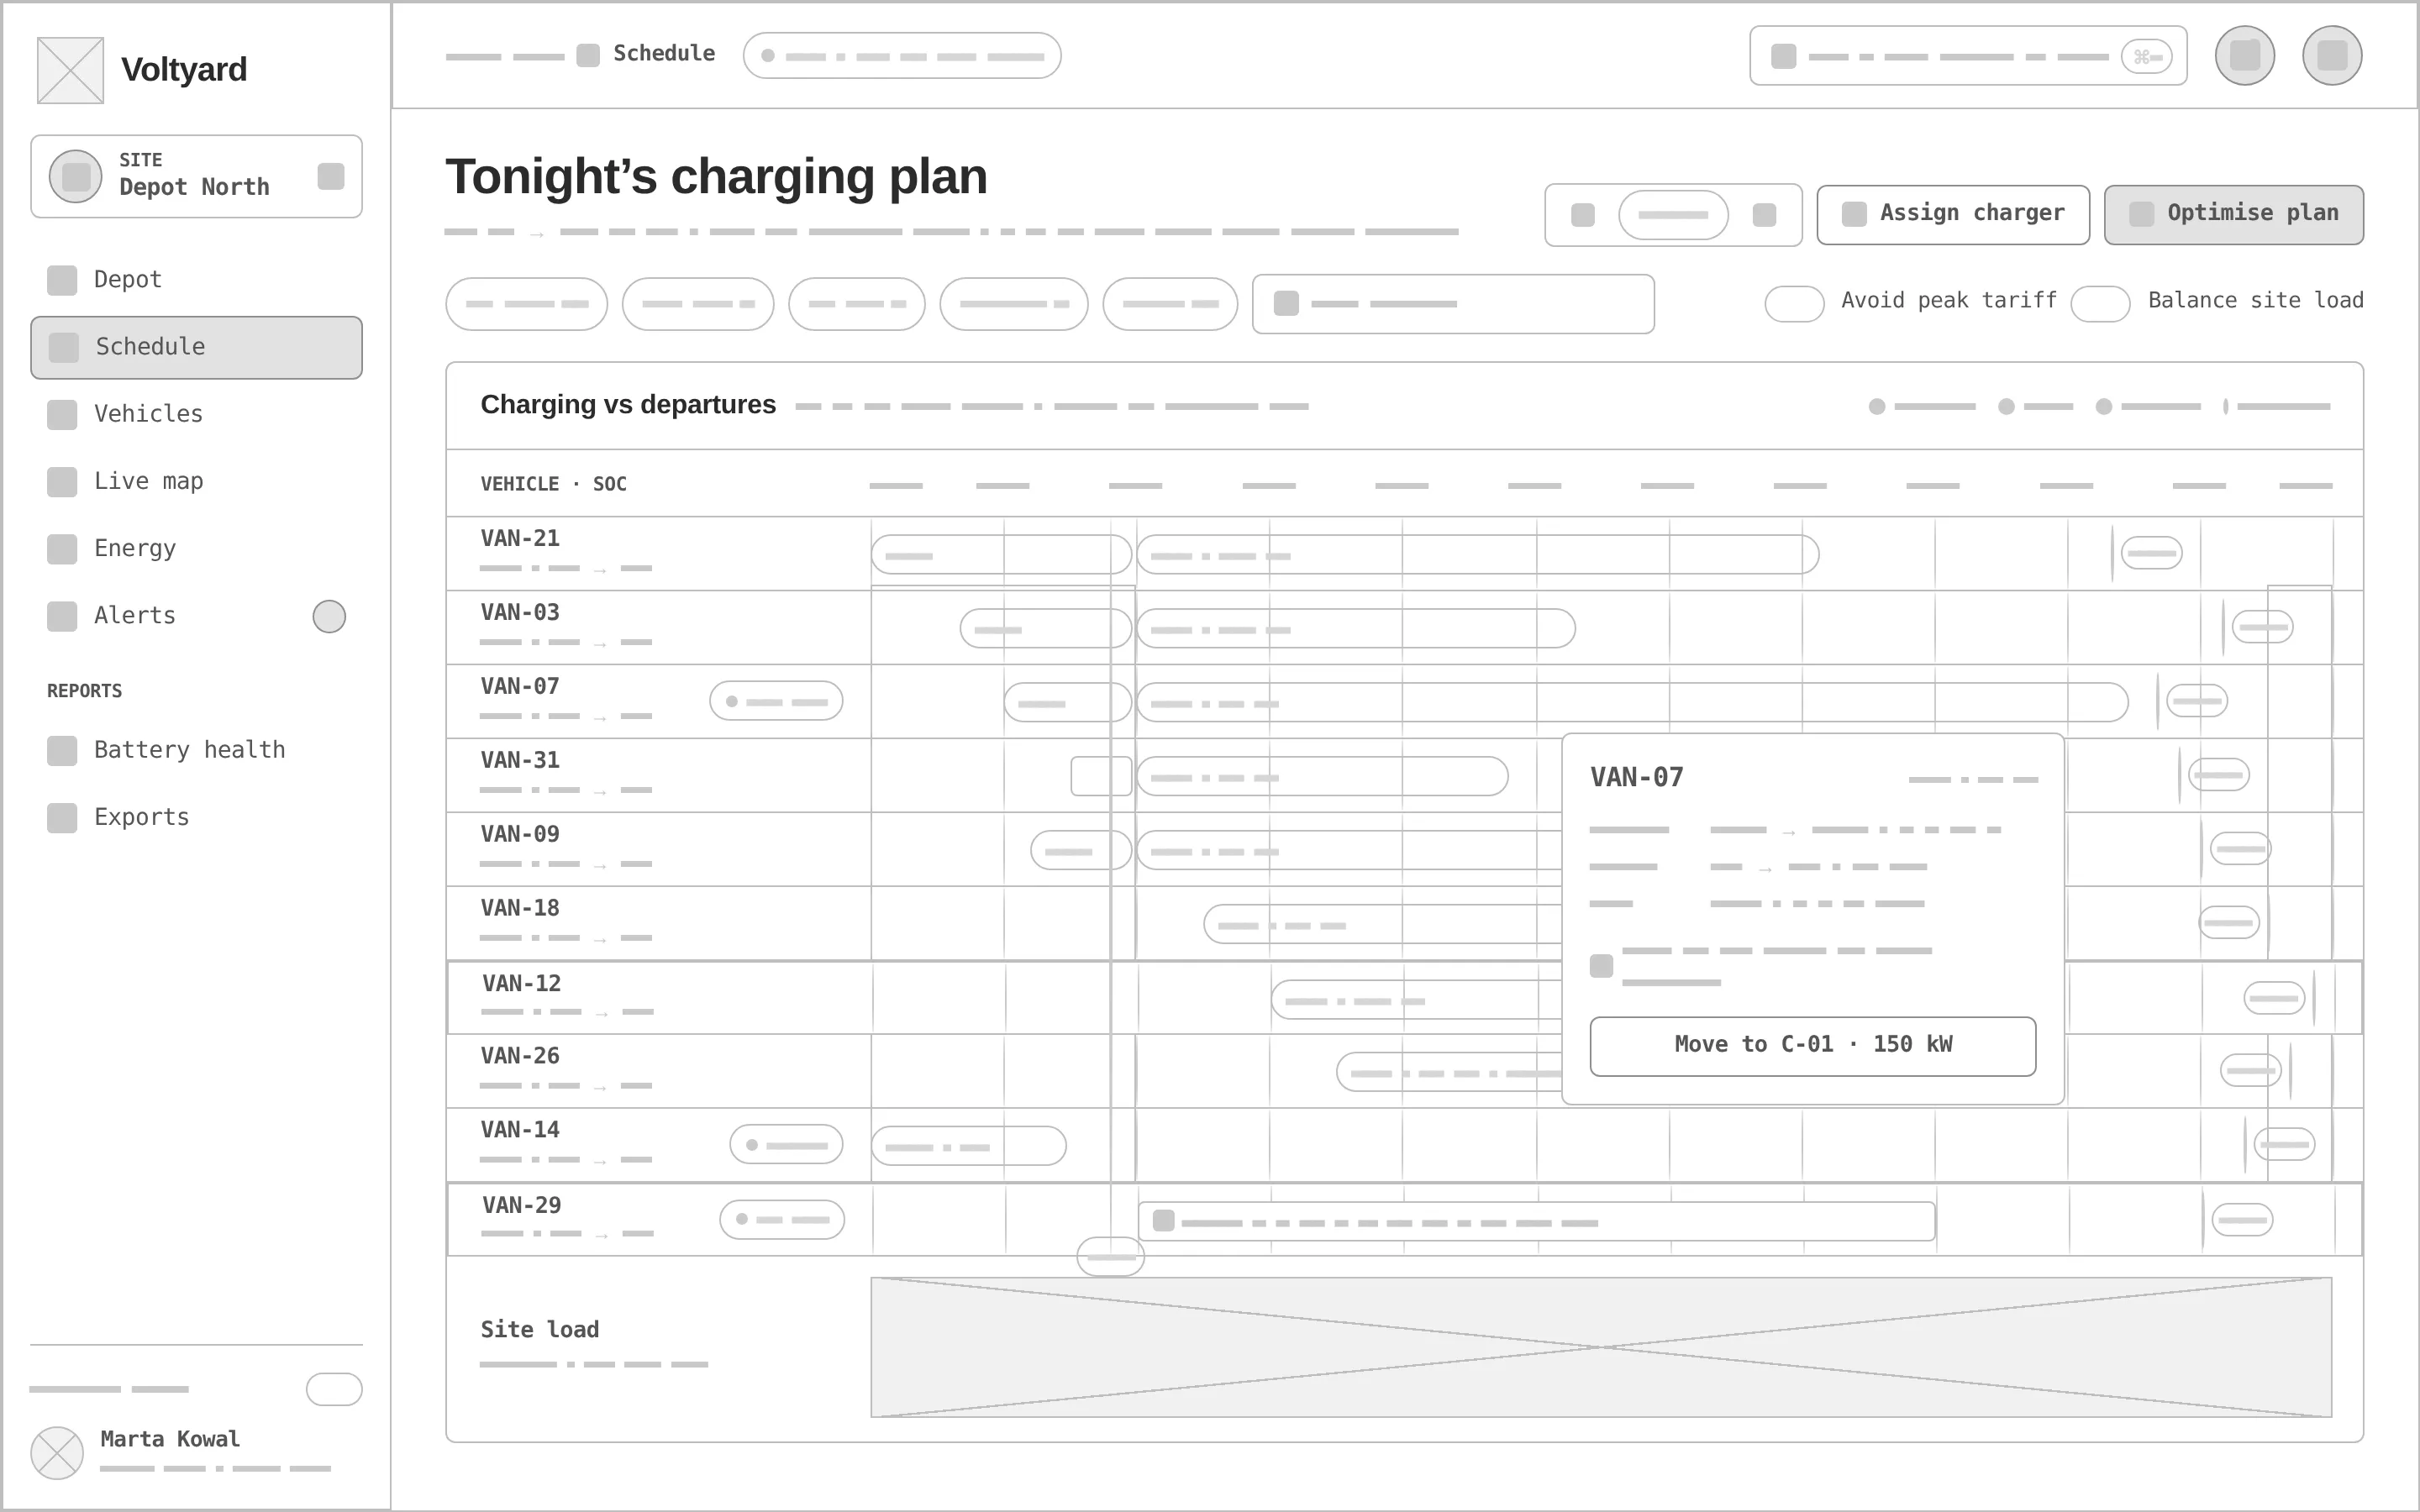
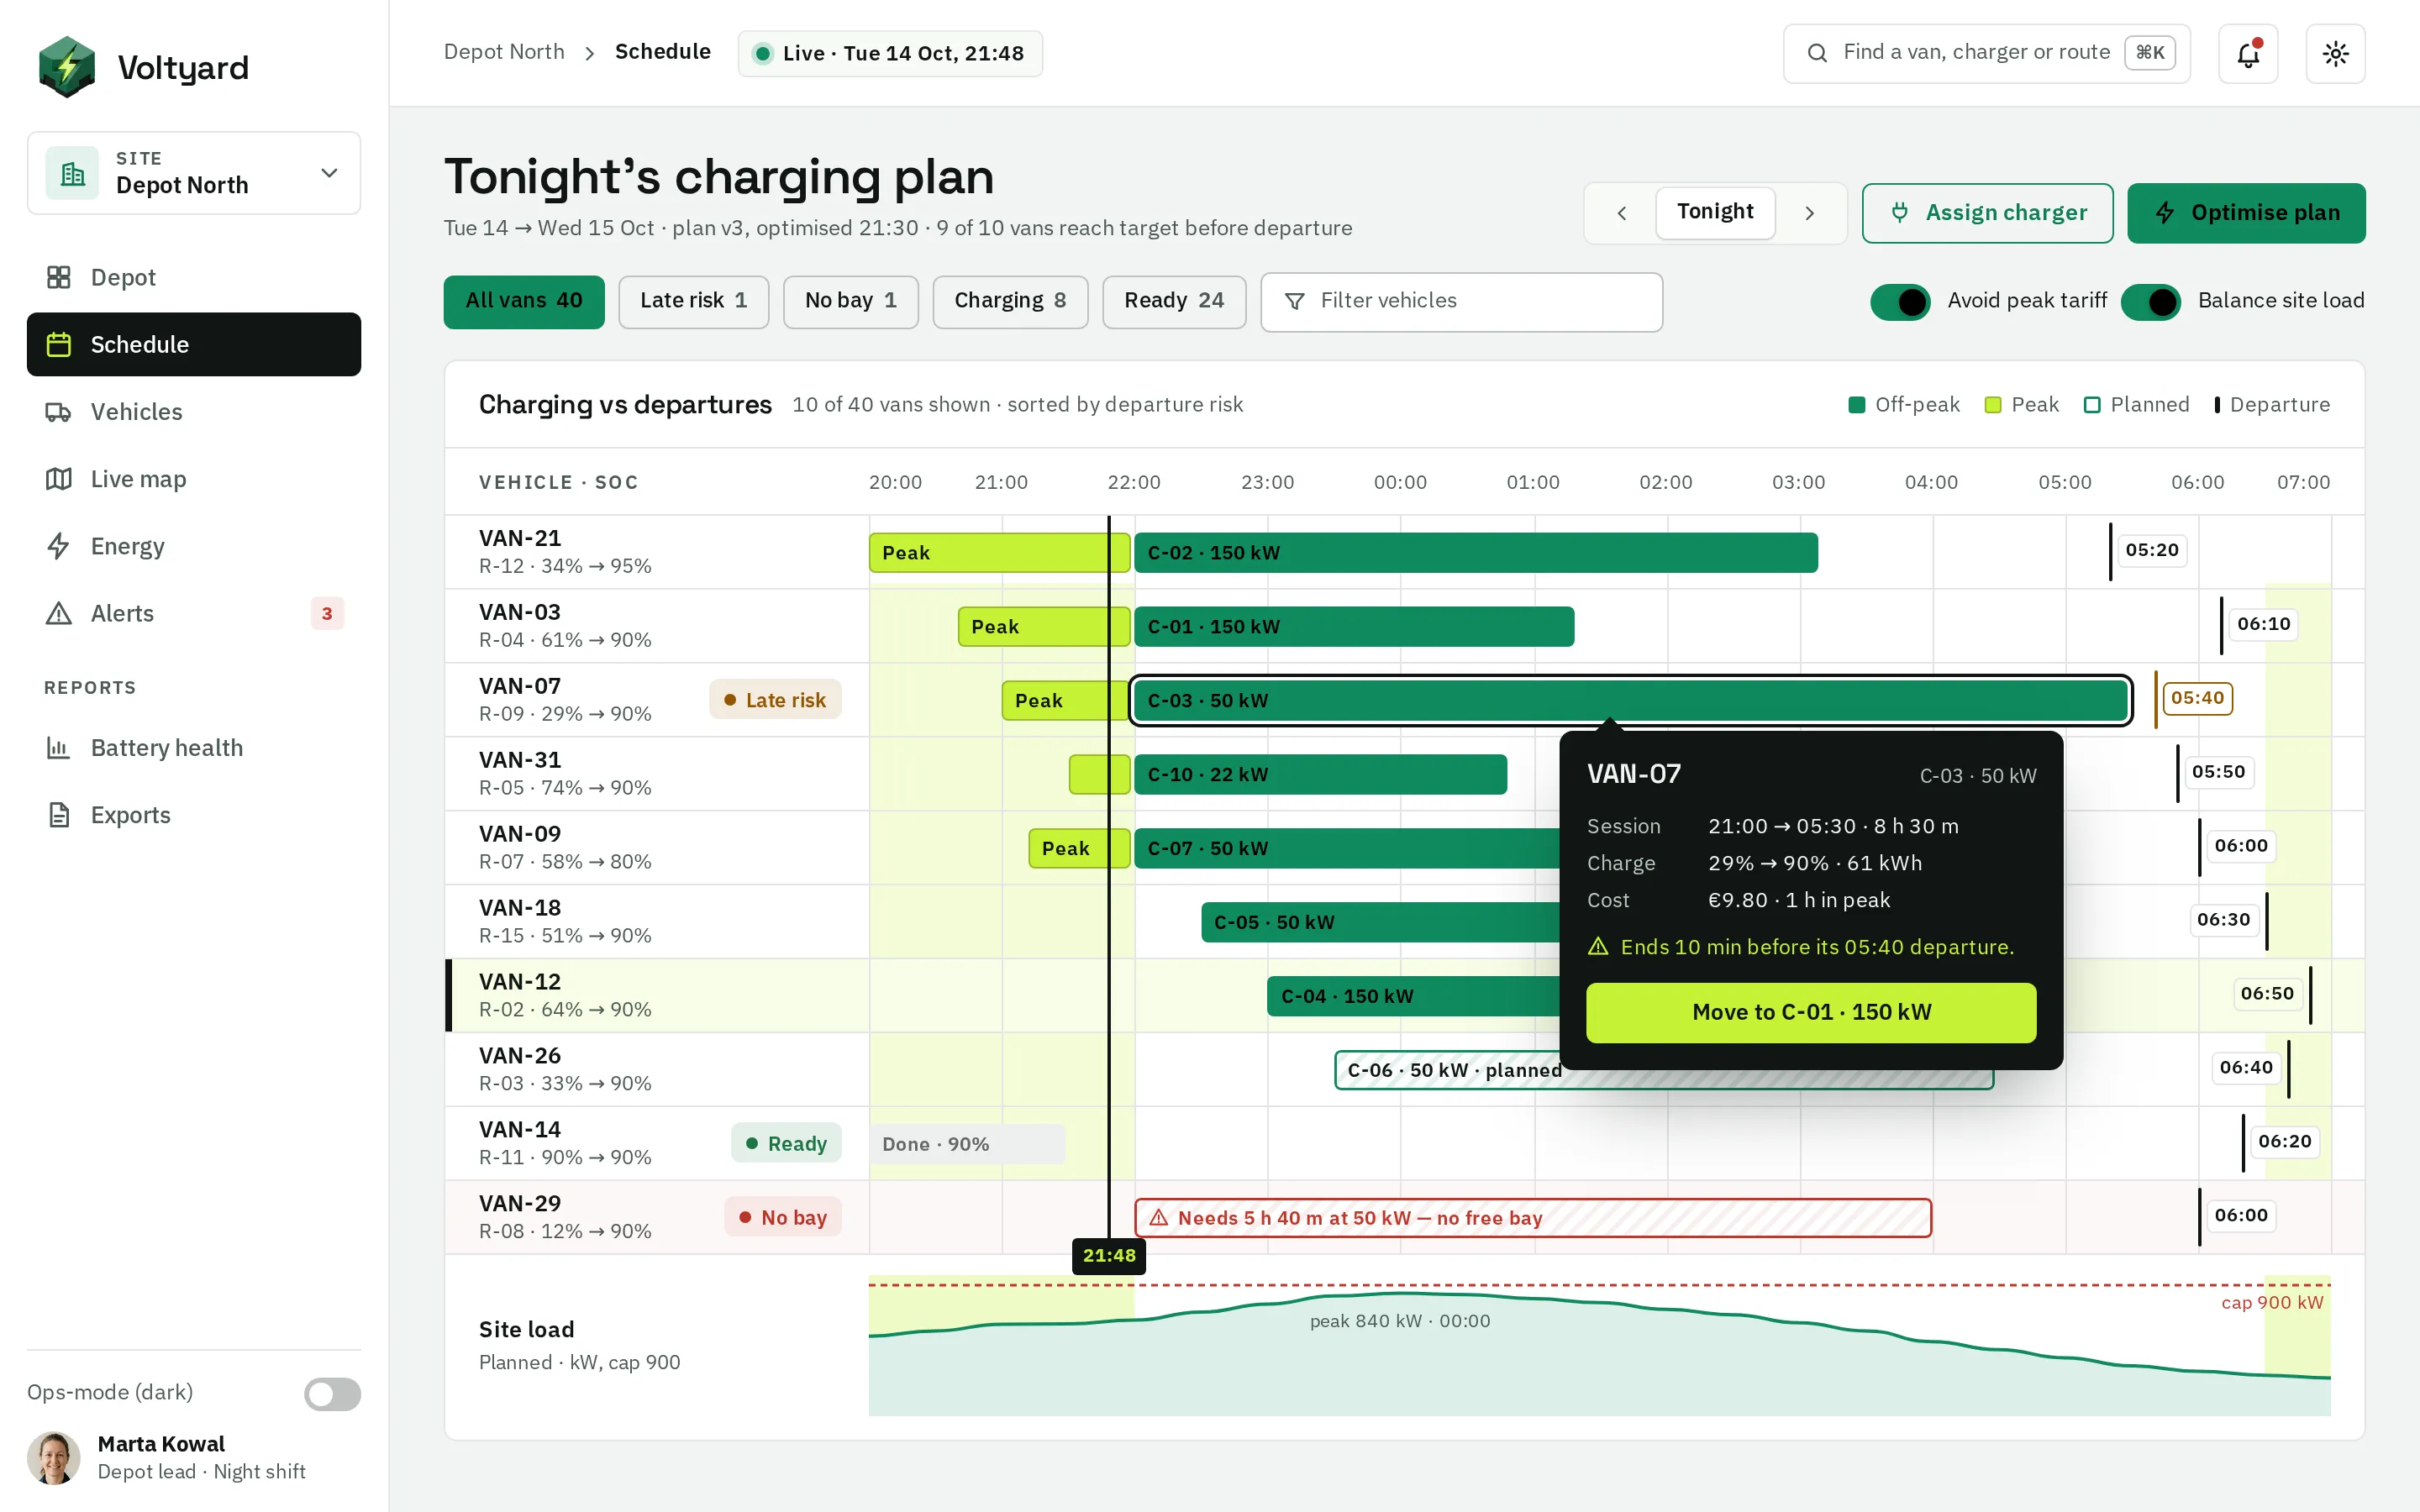
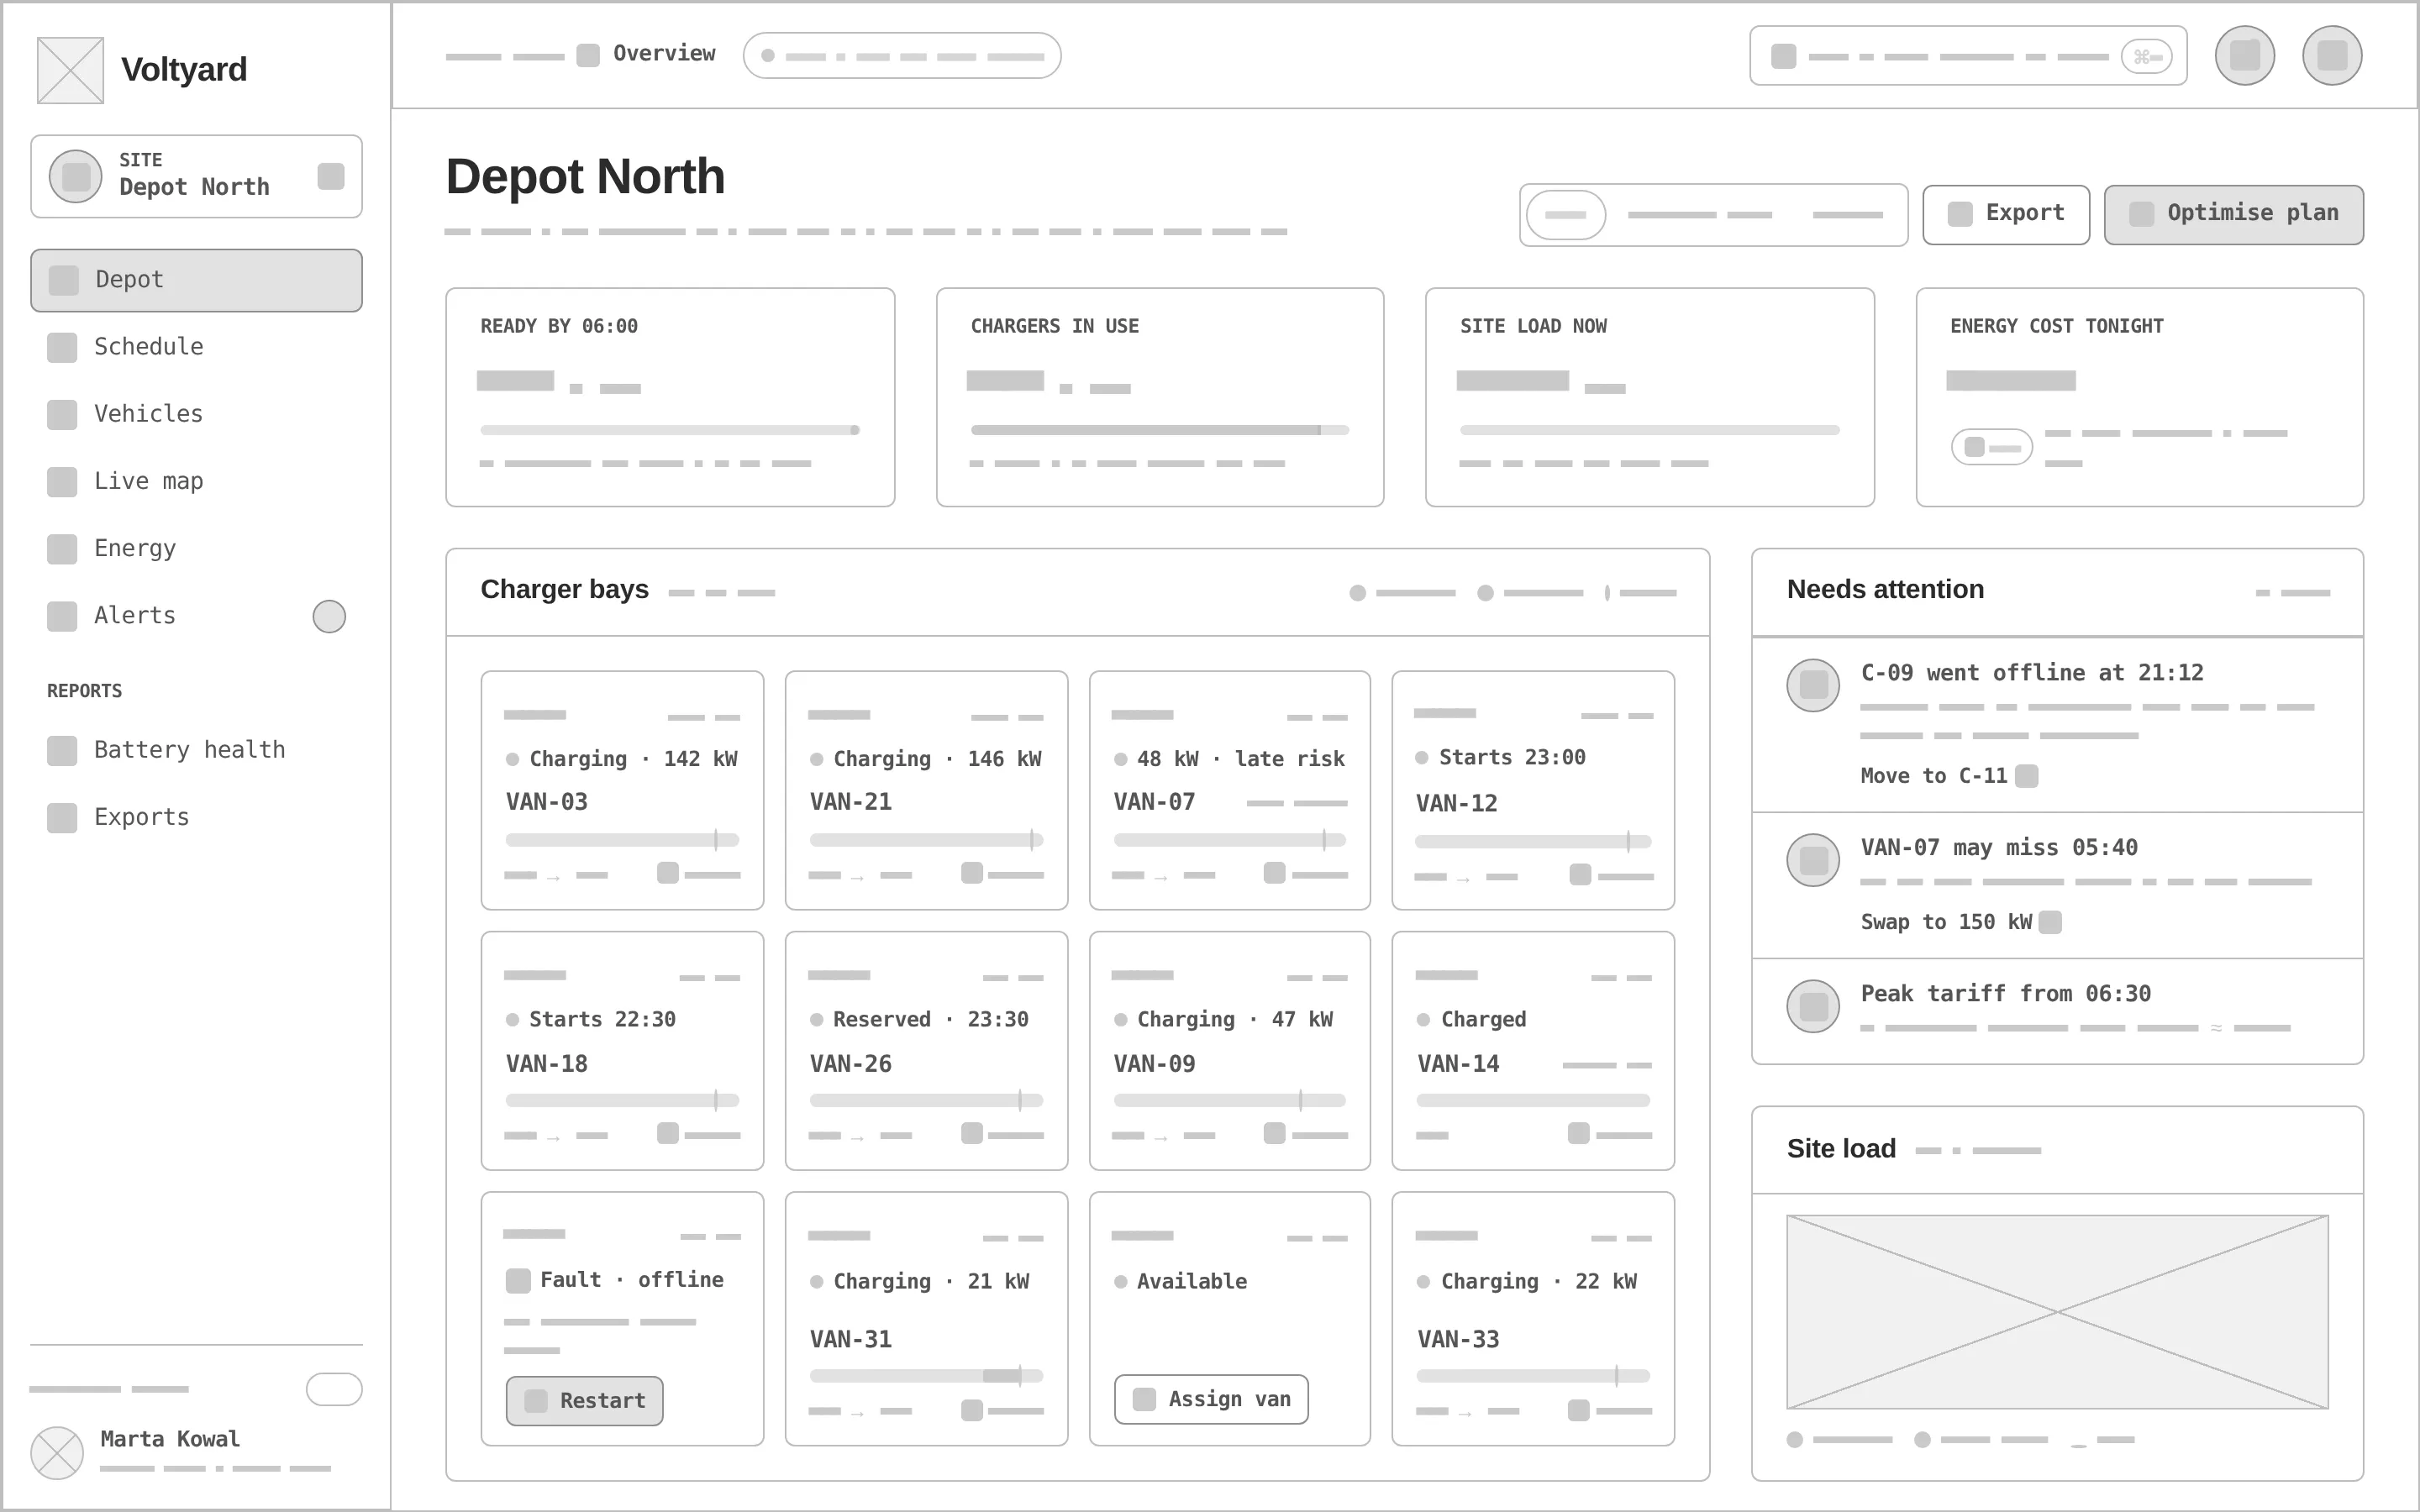
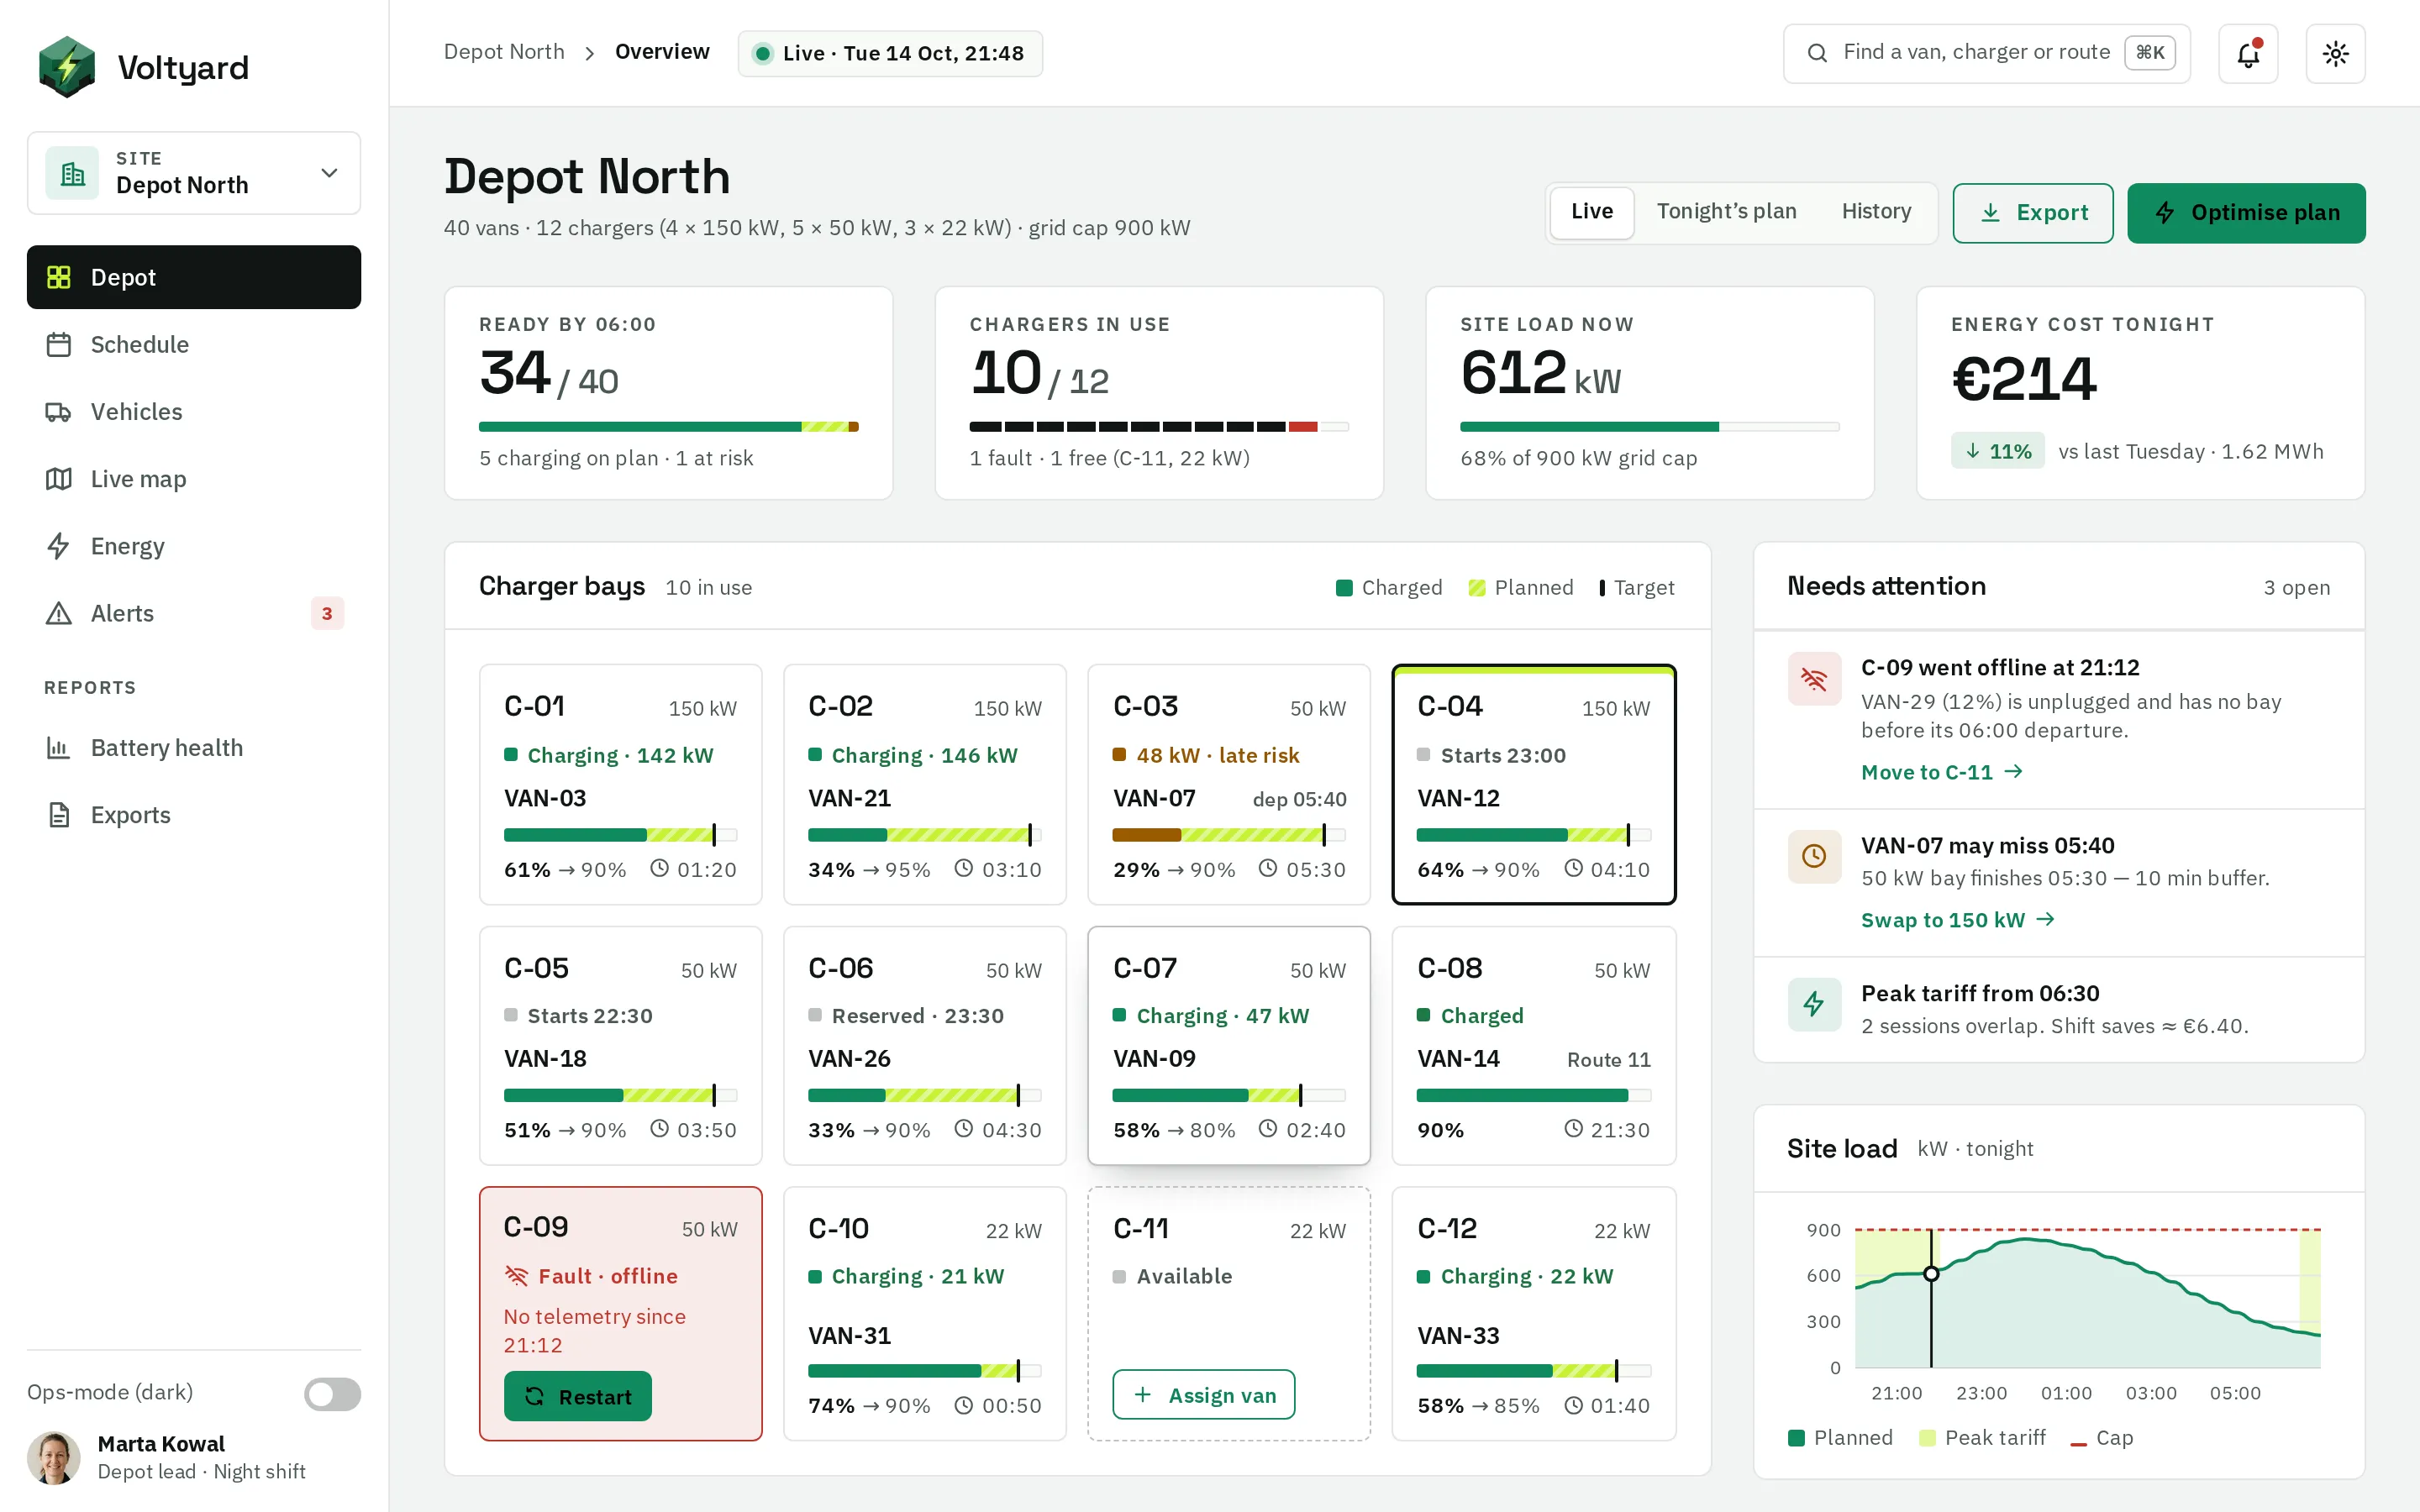
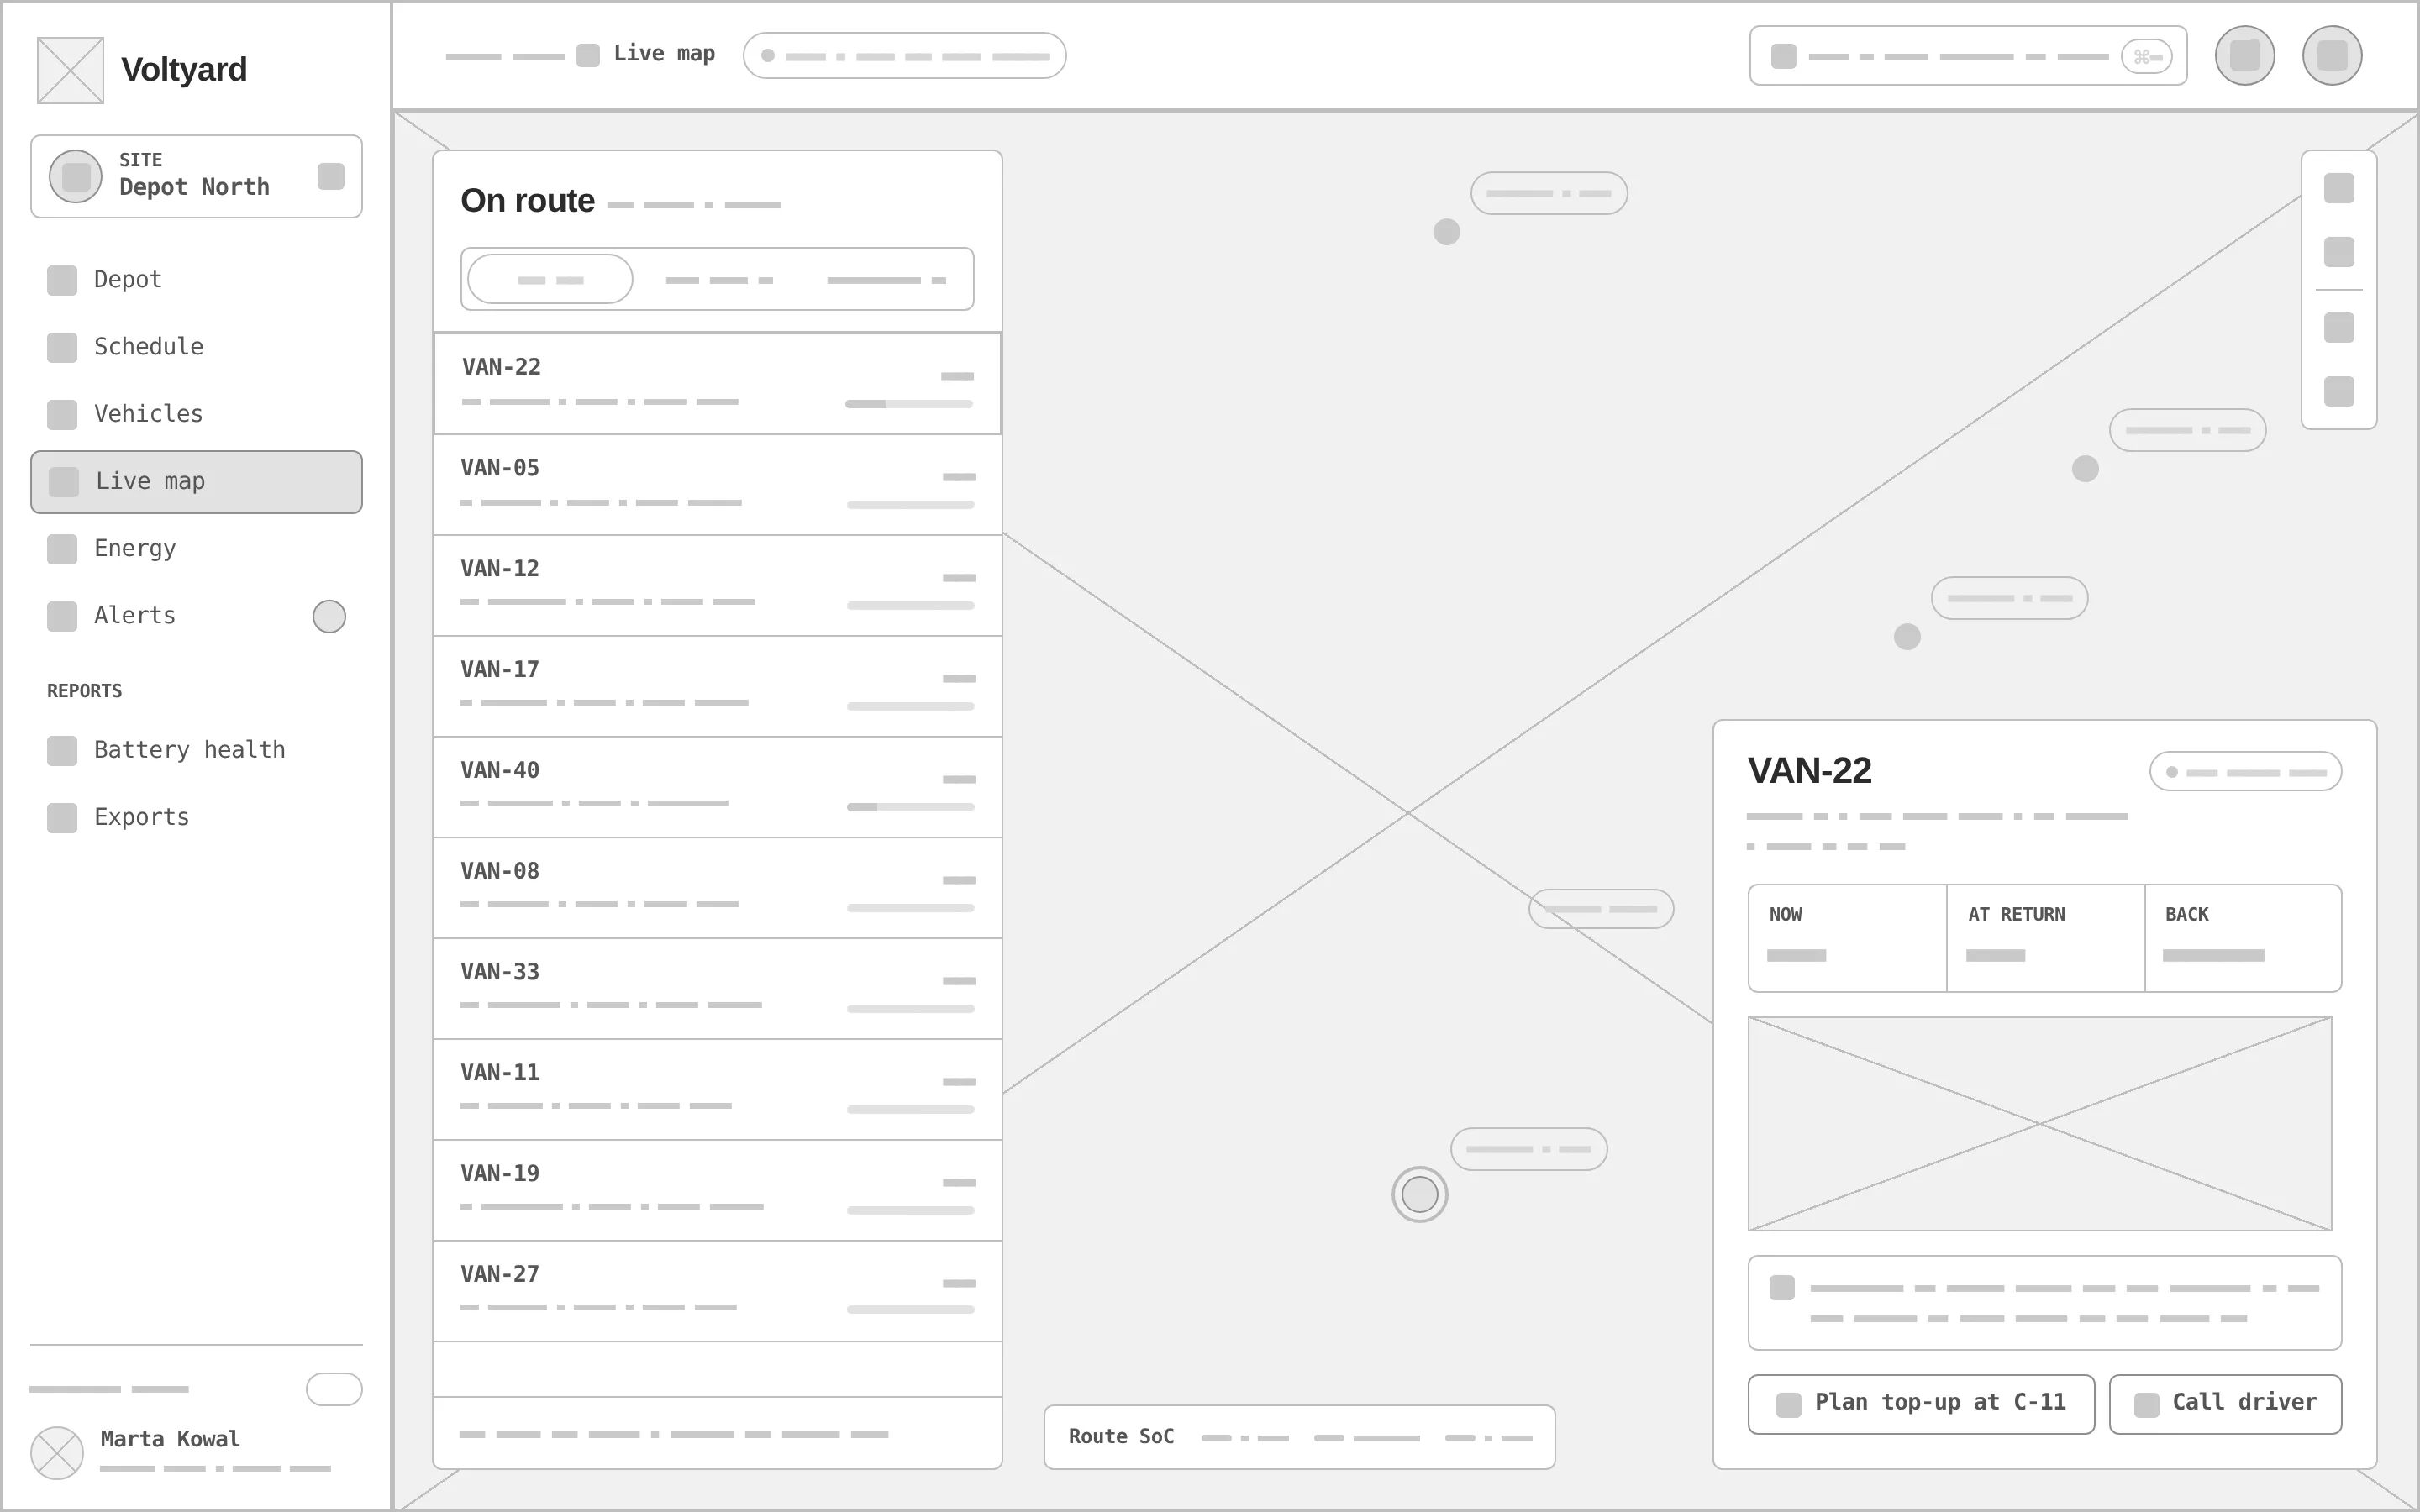
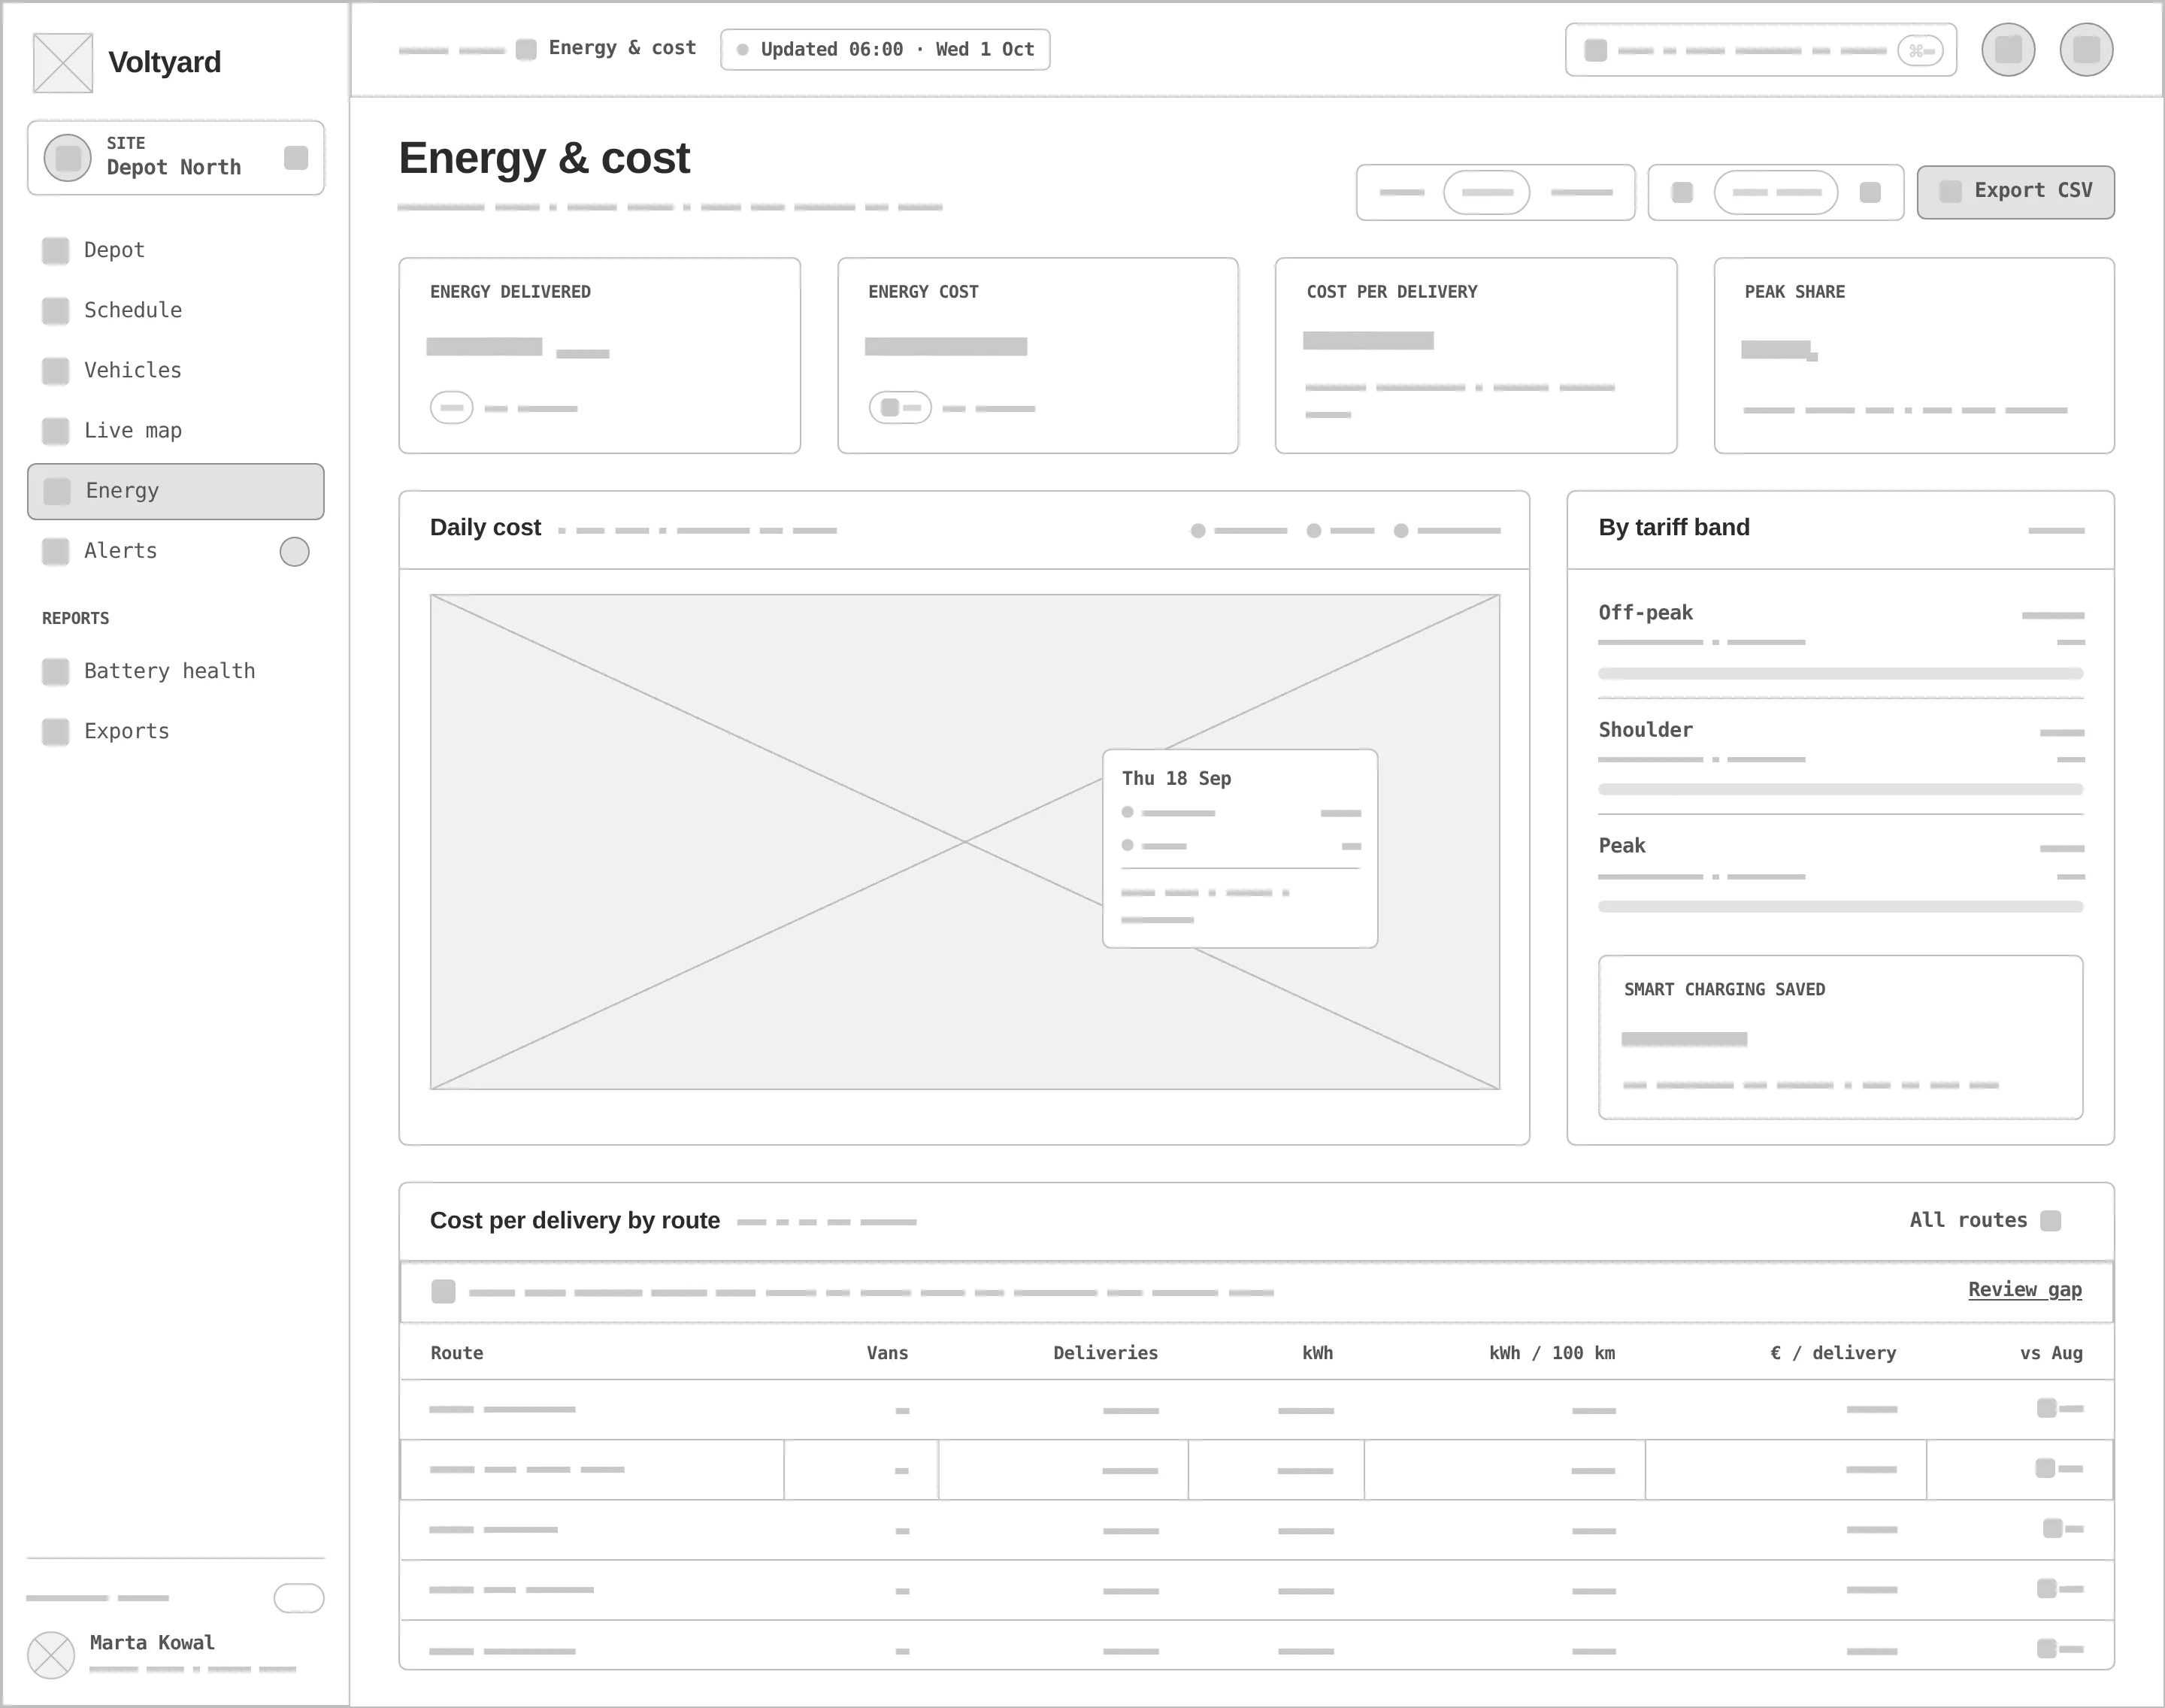
Every «before» is generated from the very same screen markup, reduced to outlines, readable labels and grey word-bars — no colour, charts or map. Drag the handle to compare.
- 01
Hierarchy
Risk before inventory: «9 of 10 vans reach target» in the subtitle, late-risk and no-bay vans flagged in the Gantt, «Needs attention» beside the charger bays.
- 02
Grid & density
A fixed sidebar and a 12-column canvas; big numerals in the KPI row, dense Gantt and table rows where the night lead scans.
- 03
States
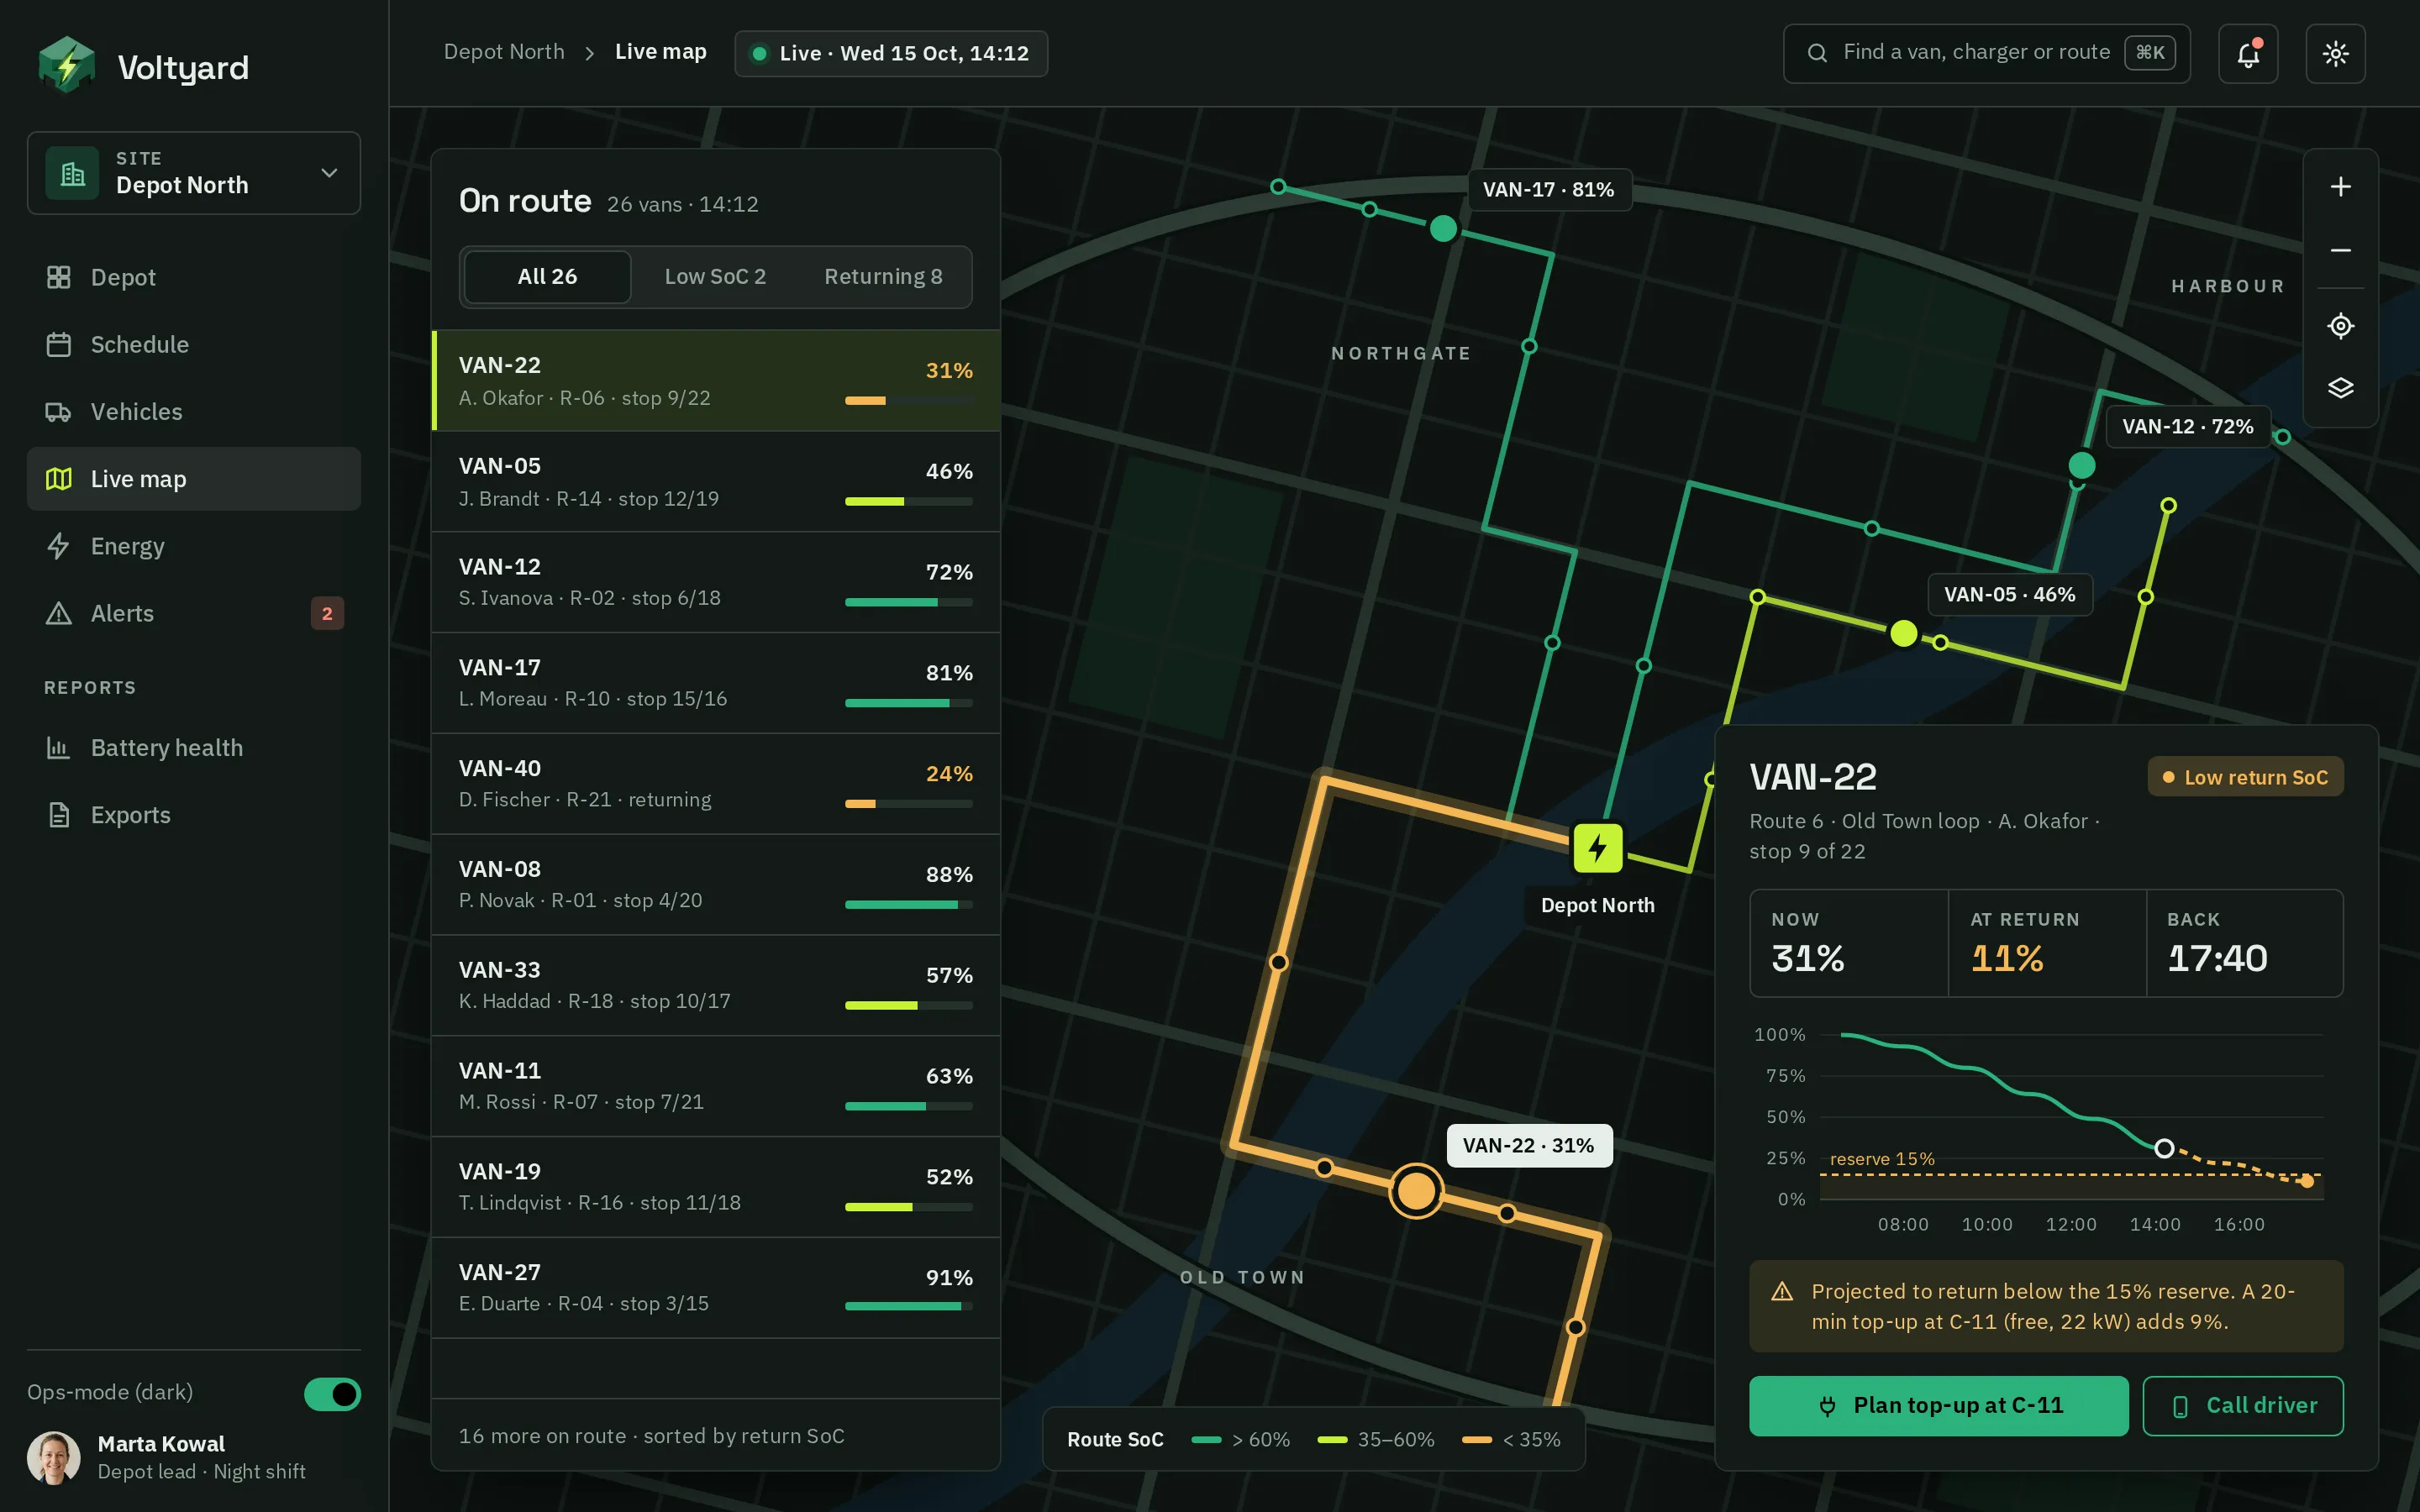
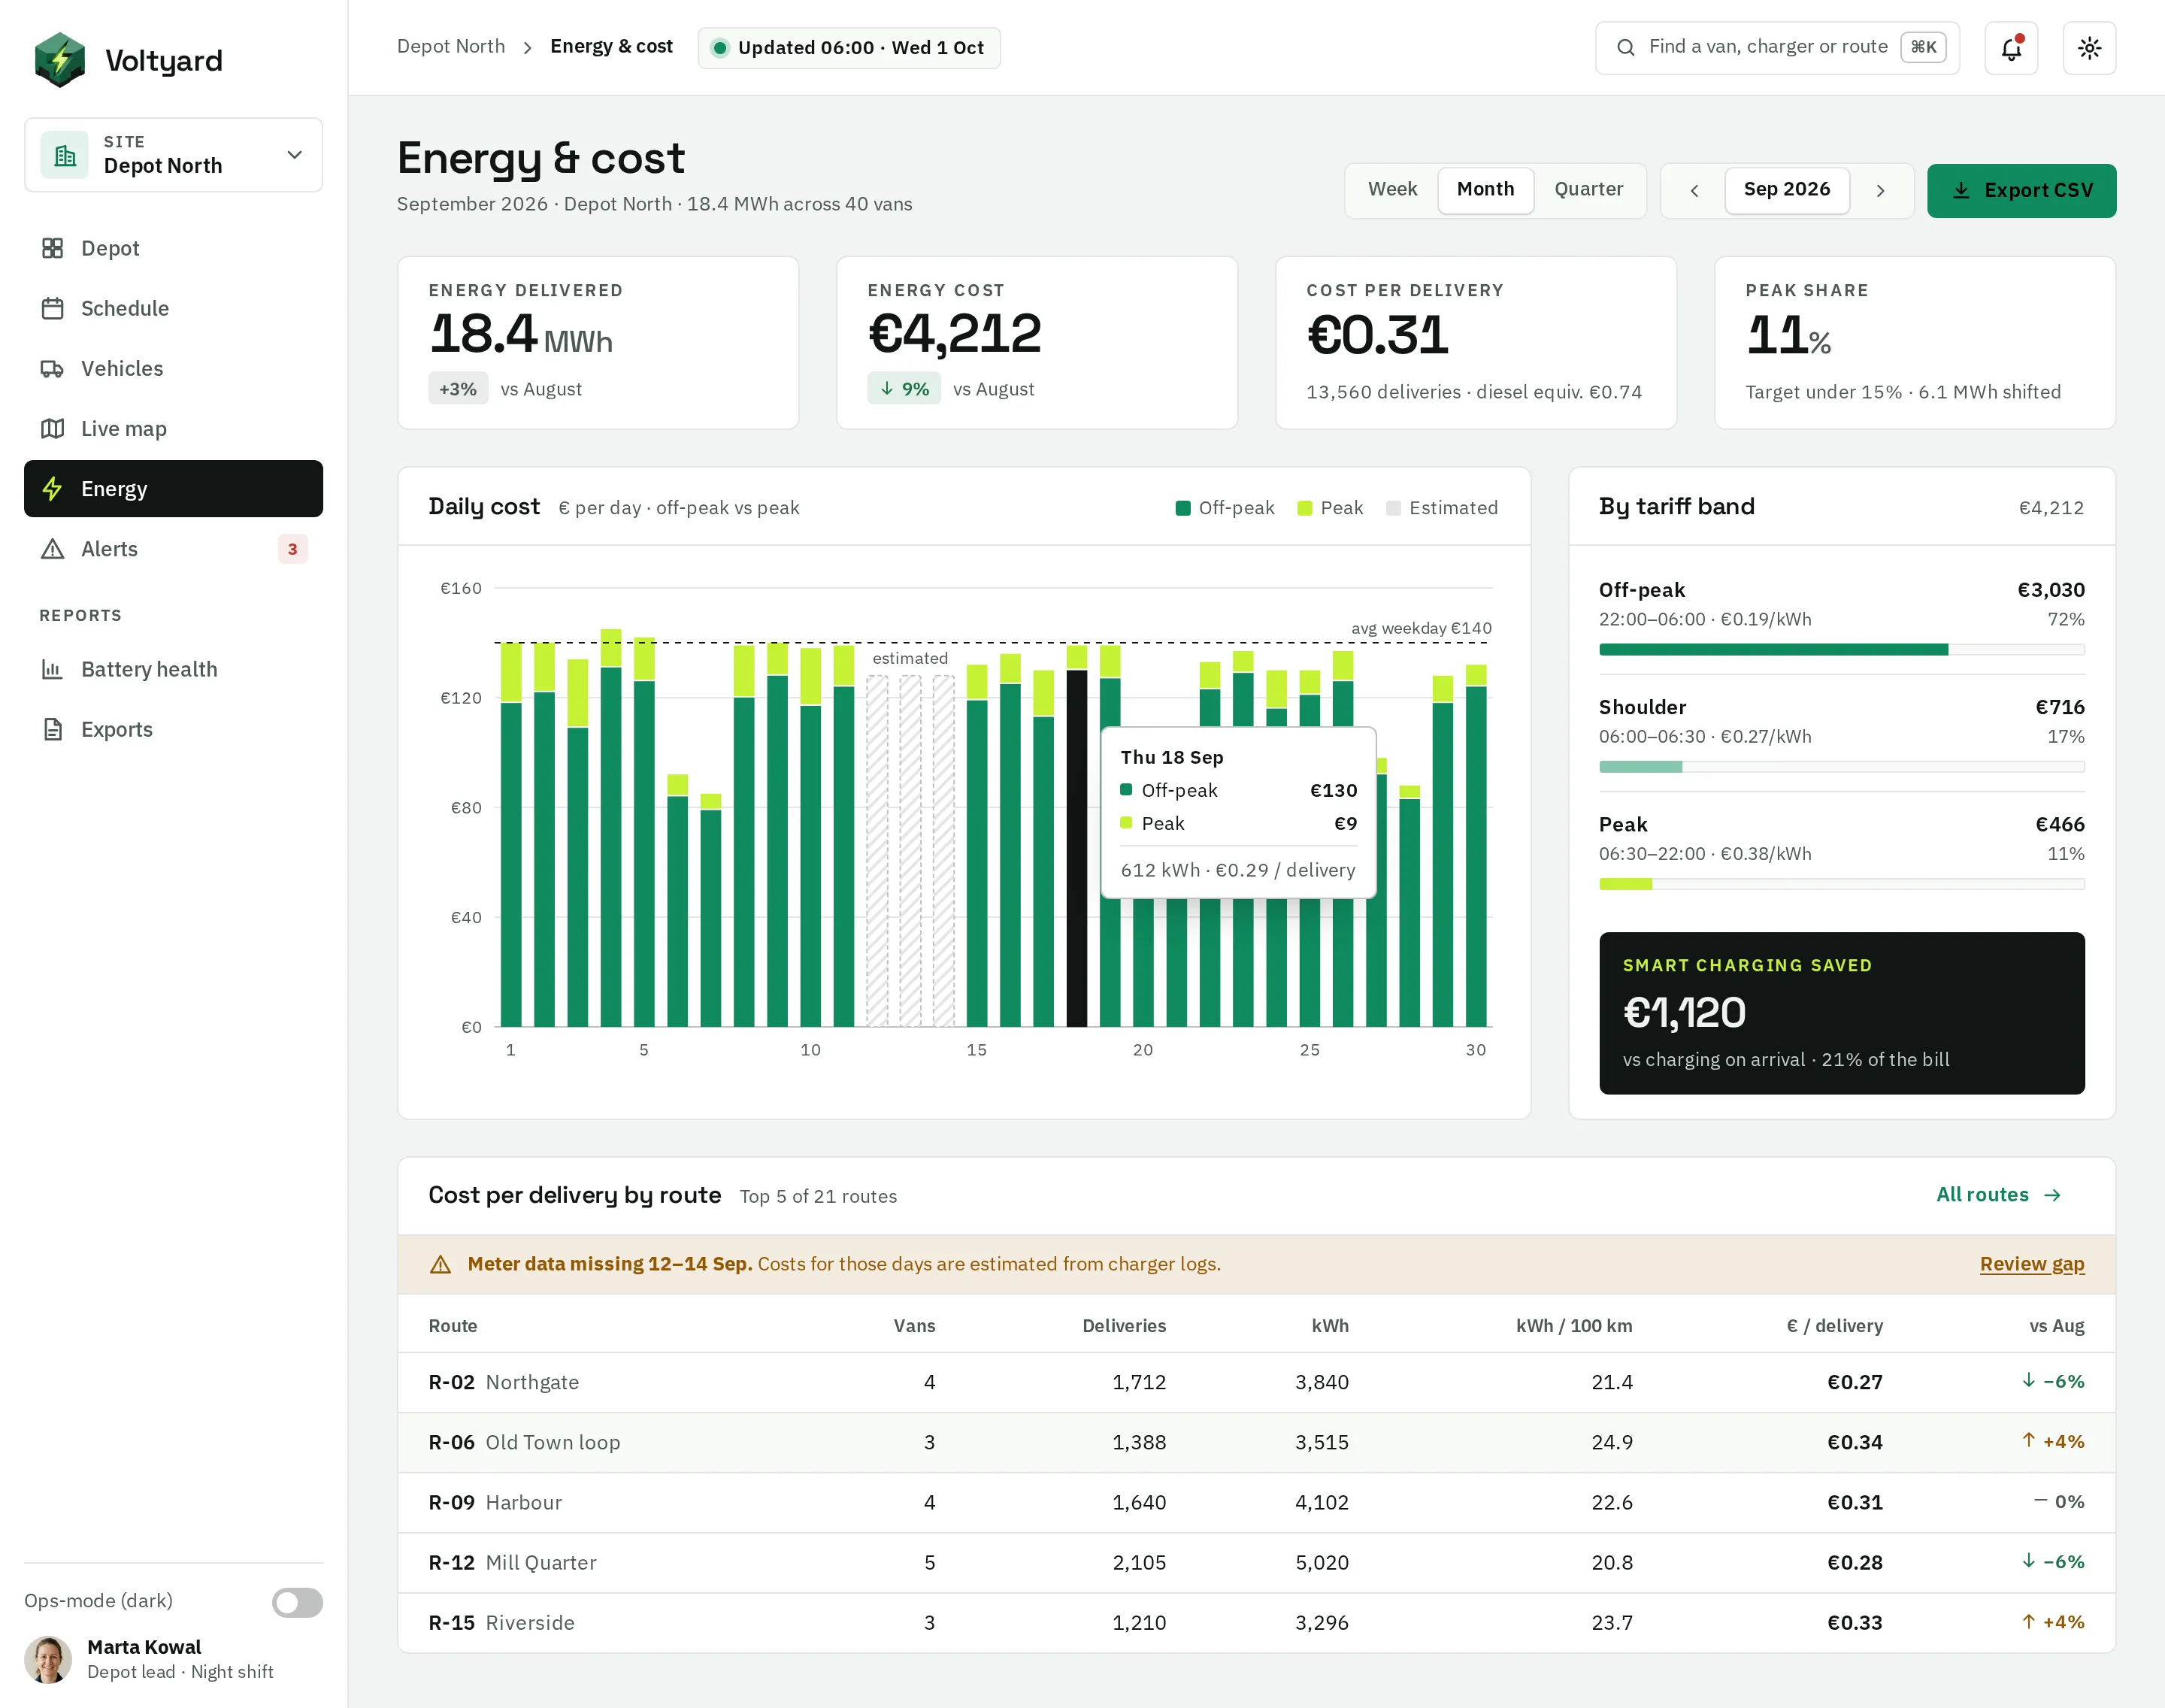
Charging / starts at / late risk / fault / available bays, a selected van with tooltip, a no-free-bay row, a low-return-SoC van on the map, a meter-data gap in the report.
- 04
Vector, on purpose
No photos or 3D inside the product: map, charts, state-of-charge bars and icons are drawn vectors — operations software should look like an instrument. 3D lives only in the brand mark.
- 05
Two themes
Office-light for planning; ops-mode dark for the live map at night, with the same lime and green reading on both.
- 06
Real-looking data
40 vans, 4 × 150 kW / 5 × 50 kW / 3 × 22 kW chargers, a 900 kW grid cap and a cost per delivery of €0.31 — realistic numbers test every row.
Charge green for actions, volt lime only for data.
Charge green marks actions and charged energy (black labels on it at 4.8:1); volt lime is a data highlight at 1.19:1 on concrete — peak bands, selection, the charging bolt — never text. Space Grotesk sets the engineered numerals, IBM Plex Sans the dense interface.
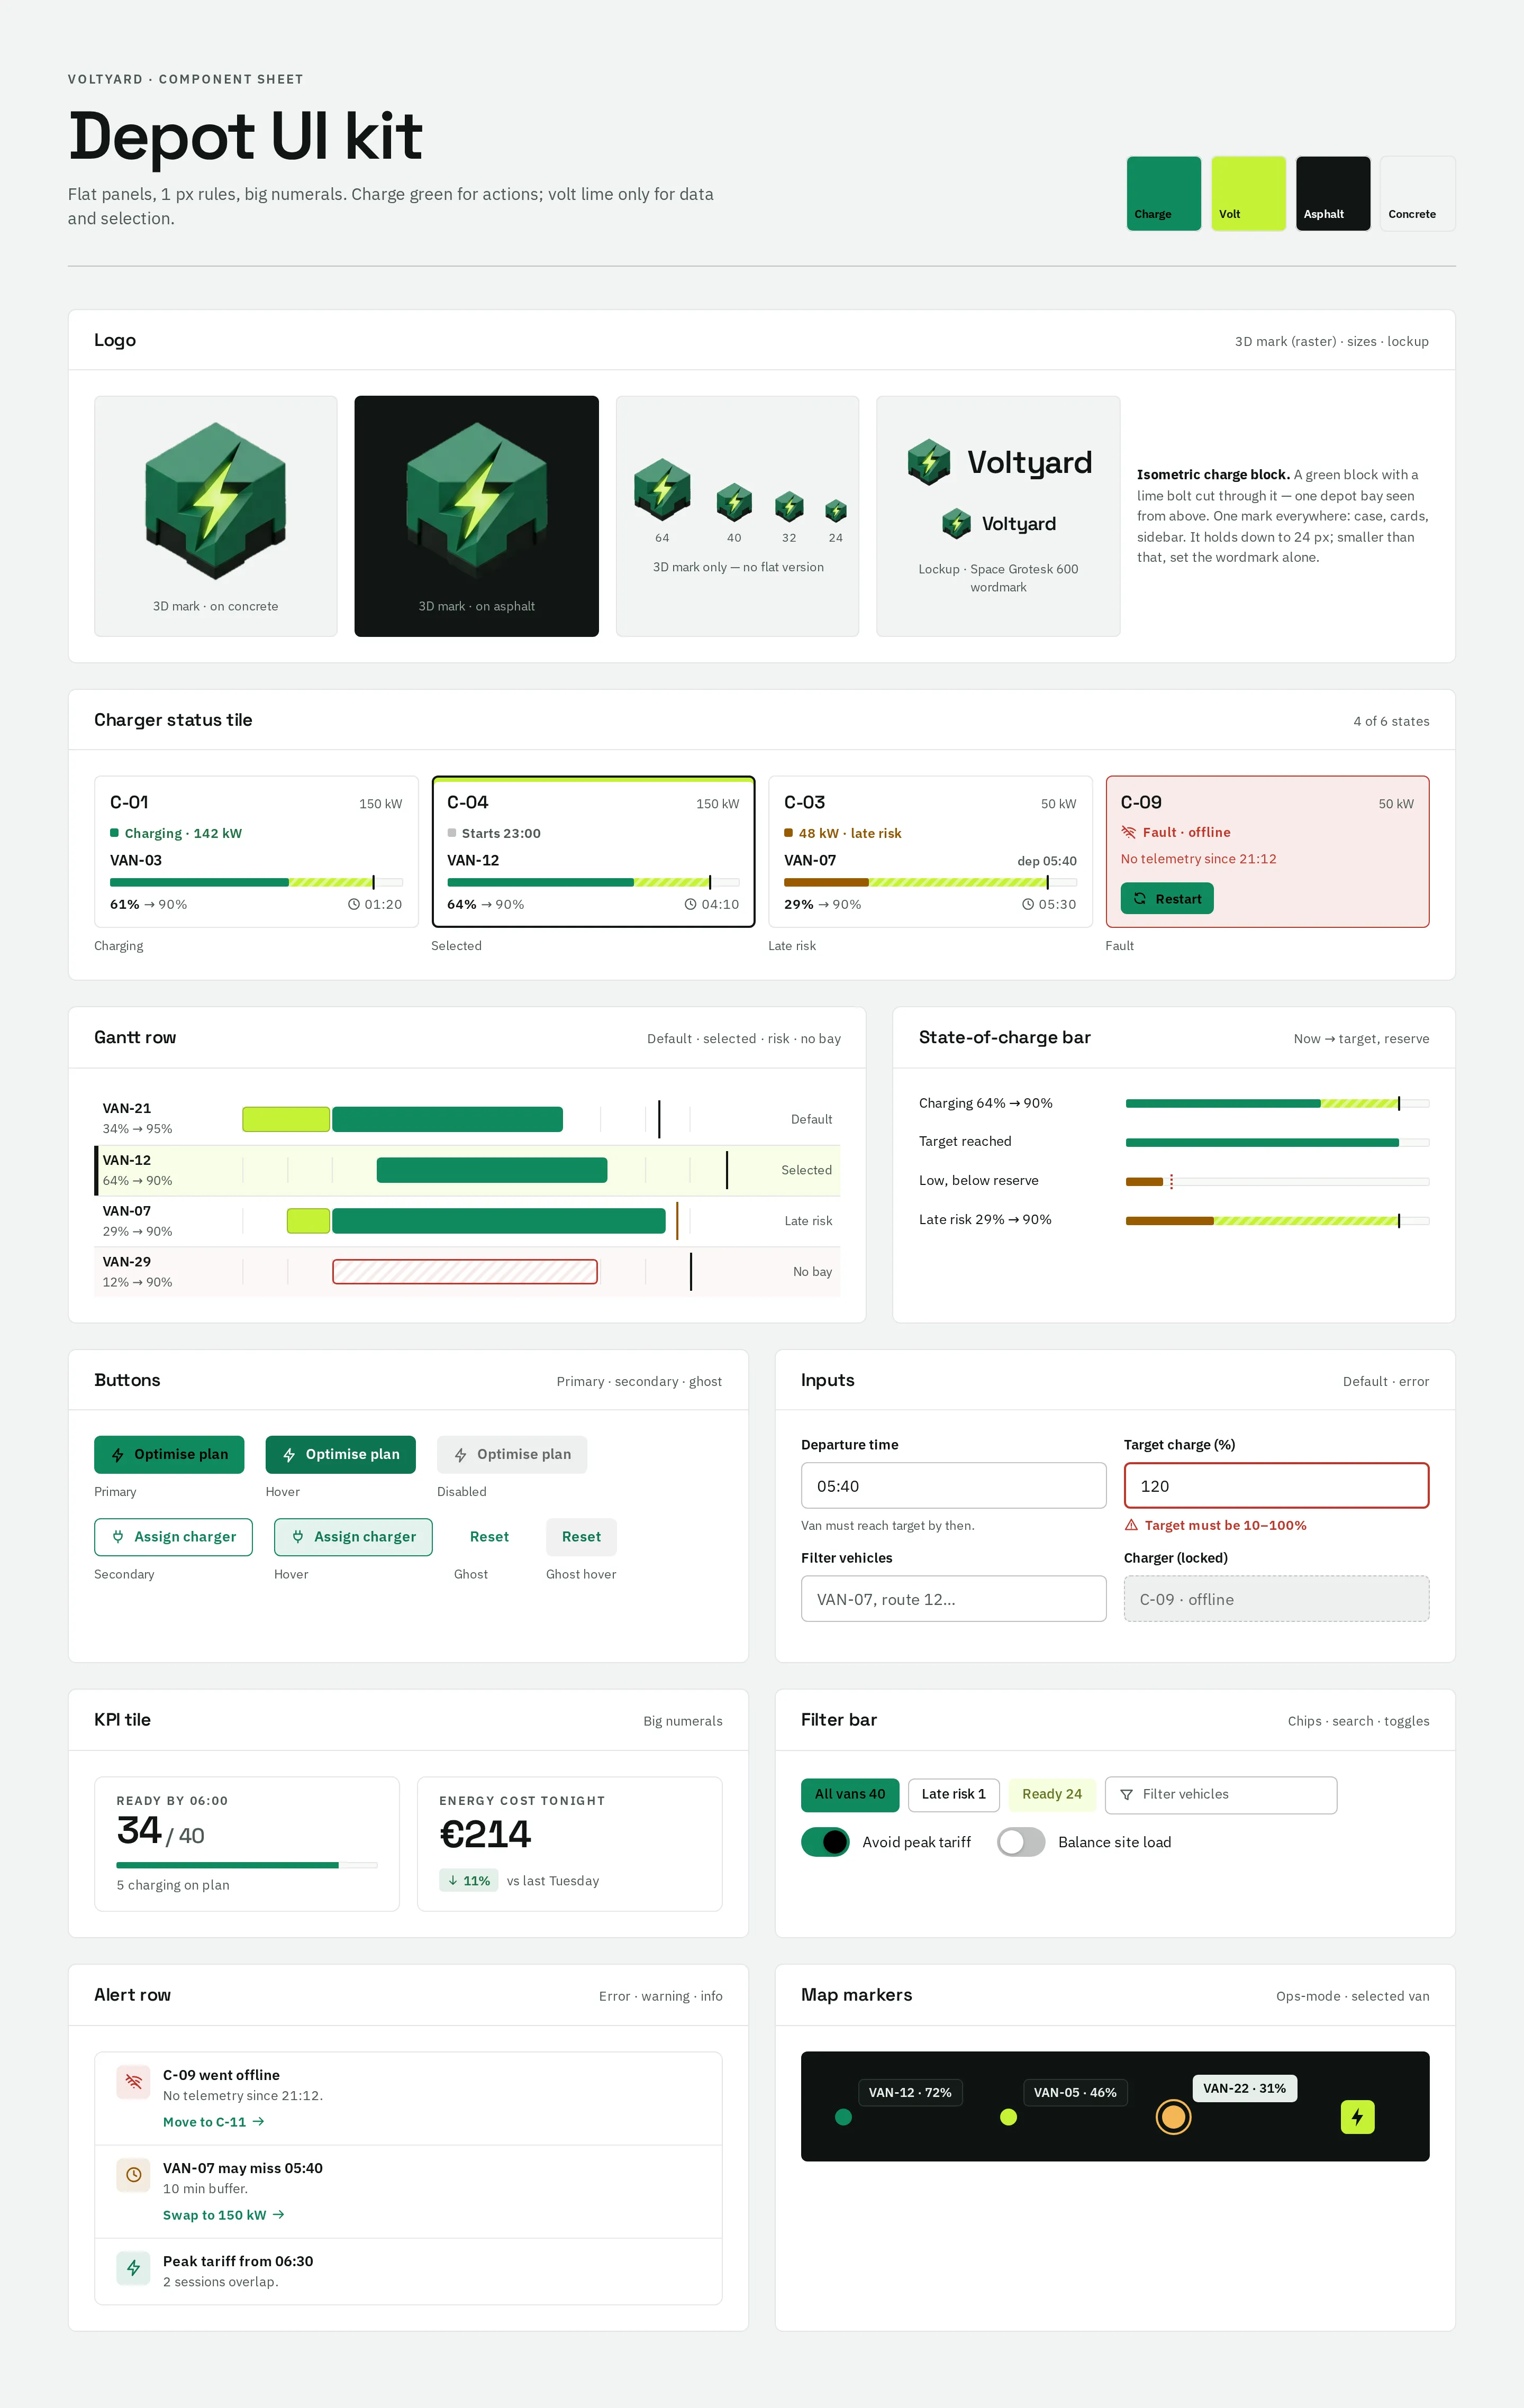
VoltyardOne mark, in 3D. An isometric charge block with a lime bolt cut through it — one depot bay seen from above. We generated four directions and picked the fourth: the most compact silhouette (block and bolt still read at 40 px in the sidebar and down to 24 px, where a plug or a van fleet falls apart), its green and volt lime are the palette itself, and it stays clear on both concrete and asphalt. There is no flat version — the same raster mark sits in the product, on the case and on the cards, next to a Space Grotesk wordmark.
#0F8A5F
vs bg 3.94:1 · label 4.82:1
#C6F135
on bg 1.19:1
#101614
on bg 16.58:1
#F2F4F3
text on it 16.58:1
#FFFFFF
text on it 18.31:1
#4D5A55
on bg 6.53:1
Accent / bg 1.19:1 — volt lime is for data highlights, selection and fills with dark text, never for text or signal icons.
Space Grotesk 600Voltyard
Space Grotesk 600Fleet & depot managers at last-mile logistics companies
IBM Plex Sans 400 · 16/26Depot command center for electric delivery fleets: charging schedule vs routes, battery health and energy cost per delivery.
IBM Plex Sans 600 · 12logistics / EV fleet
Four screens for one night shift.
Depot overview
Ready by 06:00, chargers in use, site load and energy cost tonight; twelve charger bays in their states and what needs attention — a fault, a late risk, a peak overlap.
Gantt against departures
Peak tariff, the charging session and the departure marker on one row — risk is a gap you can see.
Charger bays
Twelve bays, one tile each: charger, power, van, state of charge to target and time to full.
Tonight's charging plan
Each van's charging session against its departure, peak-tariff hours shaded, a late-risk van selected with a faster charger suggested, the site load under the cap.
Live map · ops-mode
Vans on route sorted by return state of charge, routes on a dark map, and VAN-22 projected to return below reserve — with a top-up planned.
Energy & cost
The month's energy, cost and cost per delivery; daily cost split off-peak / peak with estimated days, tariff bands, smart-charging savings and cost per route.
Component sheet
Charger status tile in four states, Gantt row (default / selected / risk / no bay), state-of-charge bar, buttons, inputs with error, KPI tile, filter bar with toggles, alert rows and map markers.
IndustrialElectricLegible
Questions & answers
Is Voltyard a real product?
No. Voltyard is a self-initiated concept by Omnisense — a brief we set ourselves, with no client and no business metrics. All depots, vans, drivers, routes and costs in the screens are sample data, and the city on the map is invented.
Who is Voltyard for?
Fleet and depot managers at last-mile logistics companies — for example a night-shift lead with 40 vans, 12 chargers and a grid cap of 900 kW.
What is the main screen?
Tonight's charging plan: charging sessions as a Gantt against departures, with peak-tariff hours shaded and the grid cap drawn on the site load.
How does it deal with problems?
Risk first: lists such as «VAN-07 may miss 05:40», one-click fixes like «Move to C-01 · 150 kW», and the energy cost of each delivery.
What did you design?
A desktop web app: the depot overview with charger bays, tonight's charging plan, a live route map in dark ops-mode and the monthly energy & cost report — plus a component sheet, logo, palette and type system.